Loading...

Special Educational Needs and Disabilities (SEND)
Introduction
Special Educational Needs and/or Disabilities (SEND) are a crucial aspect of the educational system, affecting a significant portion of children and young people. As of January 2025, approximately 1.6 million pupils in England were identified with SEND, an increase of 85,925 from the previous year. In Oldham, our rate of new children and young people coming into the SEND system has increased by 2.7% in 2024. The number of children and young people with SEND has been rising steadily and has, on average, increased by a 12% increase year-on-year since the reforms in 2014/15.Nationally, data tells us that SEND is more prevalent among boys, who constitute 71% of individuals who have an education, health and care plan (EHCP) and 61% of those getting SEN support. Furthermore, a significant number are eligible for free school meals (FSM), which is considered a proxy indicator of SEND. In 2025, 43.8% of pupils with an EHC plan and 39.3% of those with SEN support were eligible for FSM, compared to 24.6% of all pupils.
As the number of those with SEND increases, schools and educational settings are expected to deliver the necessary level of support and provision. However, to ensure we facilitate the level of support and provision required for SEND children and young people, a cross-sector approach is required. In Oldham, we work together across the local authority, the Integrated Care Partnership and our local parent/carer charity, POINT to ensure equal responsibility, accountability and commitment is embedded across education, health and care.
The following data is gathered from the Government’s latest SEN2 census and their Explore-Education-Statistics data. It provides an overview of the headlines related to SEND in Oldham.
Data Overview
| Table 1: EHCPs and SEN support comparisons | |||
| Oldham | Stat’ neighbours | National | |
| No of school age pupils | 46128 | 716290 | 9032426 |
| No of pupils with SEND | 8926 | 140564 | 1626084 |
| % who have an EHCP | 6.7% | 5.1% | 5.3% |
| % at SEN support level | 12.6% | 14.5% | 14.2% |
| Total % who have SEND | 19.3% | 19.6% | 19.5% |
| Source: SEN2, January 2025 & gov.uk | |||
Number of EHCPs
- EHCP’s have increased but at a slightly lower rate in comparison to increases nationally, regionally and for our statistical neighbours.
- Oldham as a local authority still has a higher rate of children and young people with EHCPs than national, regional and statistical neighbours averages.
- At the time of the SEN2 return (January 2025) the local area maintained 3655 EHCPs, a 10.2% increase from 2024. Nationally, in 2024 there was a 10.8% increase, 12.1% regionally and 10.3% increase for our statistical neighbours.
Requests and assessment
- There were 818 new requests for an EHCNA in the 2024 calendar year in comparison to 643 in the previous calendar year. This is an increase of 27.2%.
- Nationally, in 2024 there was a 11.8% increase, 16.0% regionally and 4.9% for our statistical neighbours.
- The number of requests for EHCNAs increased whilst the percentage refused increased and is above national.
- There were 818 new EHCNAs during the 2024 calendar year, up from 643 in 2023. Of these 818 requests, 220 were refused. This equates to 32.5% of all requests, down from 34.2% the previous year. Nationally, 25.2% of requests were refused, up from 24.0% in 2023.
- The number of assessments carried out and the percentage of assessments resulting in an EHCP being issued both increased with a much higher percentage than national resulting in a decision not to issue a plan. Nationally this increased from 5.1% in 2023 to 6.1% in 2024, locally Oldham saw a increase from 14.4% in 2023 to 19.1% for 2024.
- 640 EHCNAs were completed in the 2024 calendar year, up from 567 the previous year. Of the assessments carried out, 19.1% resulted in a decision not to issue a plan, up from 14.4% in 2023. Nationally, 6.1% of assessments resulted in an EHCP not being issued, up from 5.1% in 2023.
Rate of EHCPs, excluding exceptions, issued within 20 weeks
- Timeliness of EHCPs remains significantly above national and regional performance. Also, this is now above our statistical neighbours.
- In the 2024 calendar year, 78.8% of EHCPs were issued within 20 weeks, excluding exceptions. This is a 6.9 percentage point decrease from the 85.7 % in 2023.
- Nationally in 2024 there was a 3.9 percentage point decrease from 50.3 % to 46.4%, and a 6.2 percentage point decrease from 56.7% to 50.5% regionally.
Rate of EHCPs, including exceptions, issued within 20 weeks
- Timeliness of EHCPs continued to increase and remains above national, regional and statistical neighbours.
- In the 2024 calendar year, 79.5% of EHCPs were issued within 20 weeks, including exceptions. This is a 6.2 percentage point decrease from the 83.3 % in 2023.
- Nationally, there was a 3.2 percentage point decrease from 49.1% to 45.9%, and a 5.2 percentage point decrease from 54.8% to 49.6% regionally.
Number of new EHCPs
- The number of EHCPs issued in 2024 increased but was lower than the increase seen nationally and regionally, but higher than statistical neighbours.
- 451 new EHCPs were issued by the SEND Team in the 2024 calendar year, a 7.9% increase on the 418 EHCPs in the 2023 calendar year. Nationally, in 2024 there was a 15.8% increase, 12.1% increase regionally and a 5.5% increase for our statistical neighbours.
New EHCPs by age
- 42.9% of new EHCPs were issued for ages 5 – 10, the national average stood at 49.3%.
- The percentage of new EHCPs issued for children aged 0-5 saw a decrease from 34.1% for the 2023 calendar year to 30.9%. This is above the national average of 15.9% (down from 24.9%).
- The percentage of new EHCPs issued for the age 11 – 15 group decreased from 23.9% to 22.2%, it is below the national average of 28.2% (up from 25.7%).
- The percentage of new EHCPs issued for the age 16 – 19 group saw a increase from 2.9% to 3.8% and remains below the national average of 6.2% (up from 4.6%).
- The percentage of new EHCPs issued for the age 20 – 25 group remained at 0% whilst nationally, this remained at 0.3%.
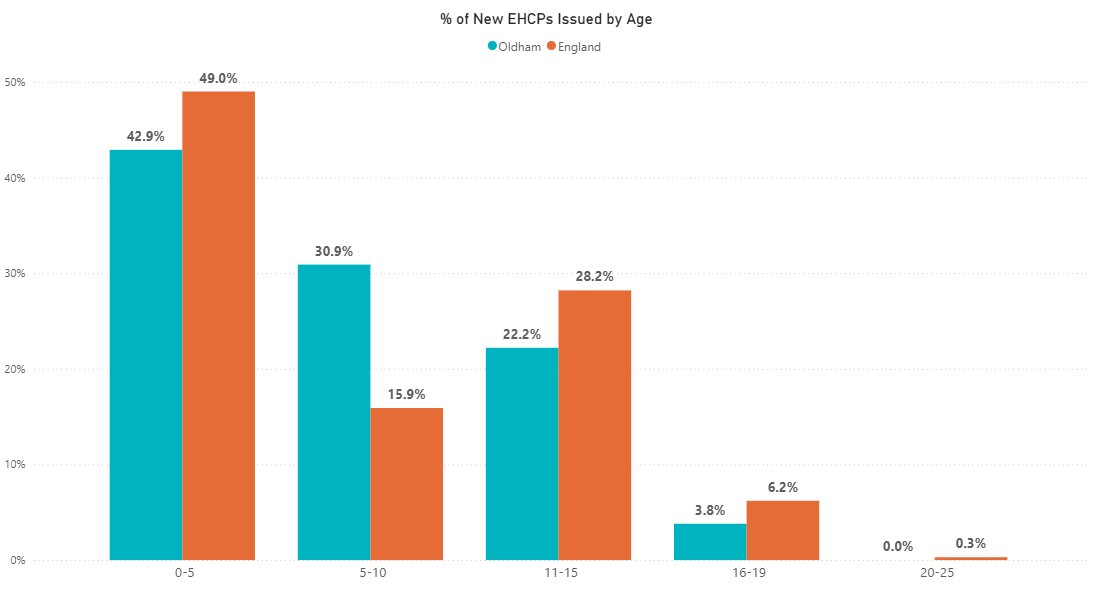 Source: SEN2, January 2025 & gov.uk
EHCPs by age
- Children of compulsory school age (5 – 15) continue to account for over two thirds of EHCPs locally in 2024 at 67.6%, in comparison to 69.9% nationally, up from 68.7% in 2023.
- The percentage of EHCPs maintained for children aged 0-5 remained at 6.9% for January 2024. Nationally, the percentage in 2024 decreased from 4.6% to 4.3%.
- The percentage of EHCPs for the 5 – 10 age group increased from 32.9% to 33.9% and is now above the national average in 2024, which increased from 32.4% to 33.3%.
- The percentage of EHCPs for the 11 – 15 age group increased from 33.6% to 34.6% and is below the national average in 2024 of 36.5% (up from 36.4%).
- The percentage of EHCPs for the 16 – 19 age group saw an increase from 19.6% to 20.0% and is now equal to the national average of 20.0% (up from 19.9%).
- The percentage of EHCPs for the 19 – 25 age group decreased from 5.9% to 5.4% and is now below the national average of 5.8% (down from 6.1%).
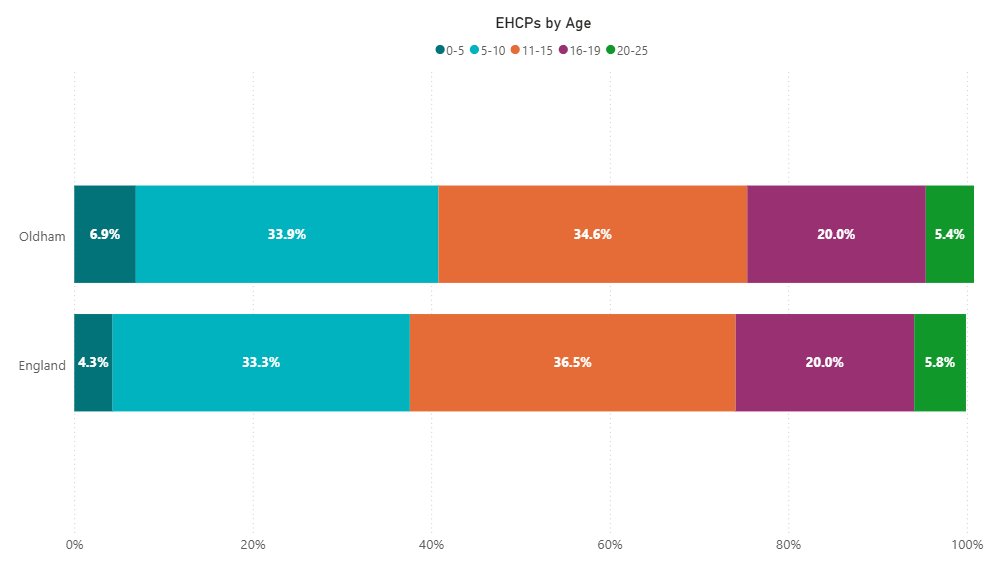 Source: SEN2, January 2025 & gov.uk
EHCPs by establishment type
- Nearly three quarters of new EHCPs issued in 2024 were for mainstream settings at 75.5%, above the national average of 75.1%.
- 73.4% of new EHCPs were for maintained mainstream settings, down from 74.6% in 2024. Nationally, this decreased from 74.9% to 69.3%.
- 0.5% of new EHCPs were for SEN units or resourced provision, down from 1.5% in 2023. Nationally, this decreased for 2024, down from 2.7% to 1.7%.
- 9.5% of new EHCPs were for special school settings, an increase from 11.9% in 2023. Nationally, this decreased from 10.7% to 9.3%.
- 2.1% of new EHCPs were for INMSS, down from 3.0% in 2023. Nationally, this decreased from 2.6% to 2.5%.
- 1.1% of EHCPs were for post-16 settings, down from 1.5% in 2023. Nationally, this increased from 2.6% to 2.8%.
- 3.0% of EHCPs were educated elsewhere, up from 1.0% in 2023. Nationally, this increased from 3.1% to 4.5%.
- 2.9% of new EHCPs were for EHE, an increase from 0.7% in 2023. Nationally, this also increased from 1.1% to 4.5%.
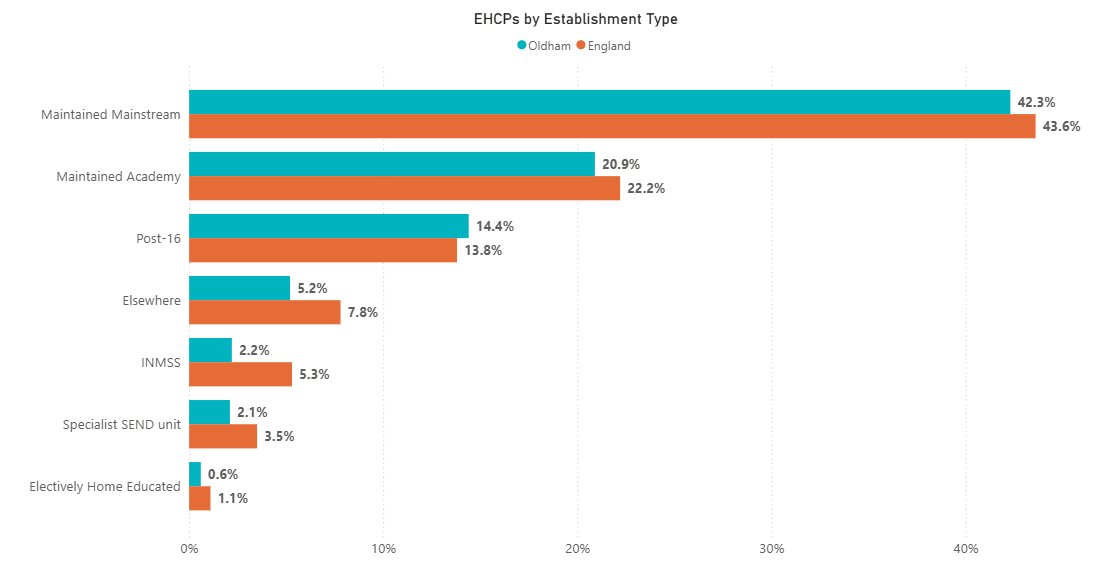 Source: SEN2, January 2025 & gov.uk
Mediation and tribunals
- The number of EHCP cases going to mediation has increased. The percentage that went on to appeal also increased.
- 345 EHCP cases went to mediation in the 2024 calendar year, an increase of 164% on the 211 the previous year of 2023. Nationally, the total number of cases increased by 174% from 5900 to 10,300.
- 8.6% of mediation cases went on to appeal, this is an increase on the 6.3% the previous year.
Further Information & Resources
Special Educational Needs in England - Academic year 2023/24This publication combines information from the school census (state-funded schools), school level annual school census (independent schools) and general hospital school census on pupils with special educational needs (SEN).
Education, Health and Care Plans, reporting year 2024
This publication provides data on children and young people with an education, health and care (EHC) plan in England and, historically, for those with a statement of special educational needs (SEN).
POINT Oldham - Additional needs and disabilities information, advice, support & empowerment
POINT aspire to an inclusive community and society without compromise, where all children and young people with additional needs and/or disabilities are treated equally and fairly.
....