Loading...


Education
Attainment
Early Years Foundation Stage (EYFS)
Figure 1 below shows that in 2023-24, 63.6% of children in Oldham achieved a good level of development, representing a slight increase of 0.8 percentage points from the previous year. However, this figure remains 4.1 percentage points below the national average of 67.7% and 0.8 percentage points below the North West average of 64.4%.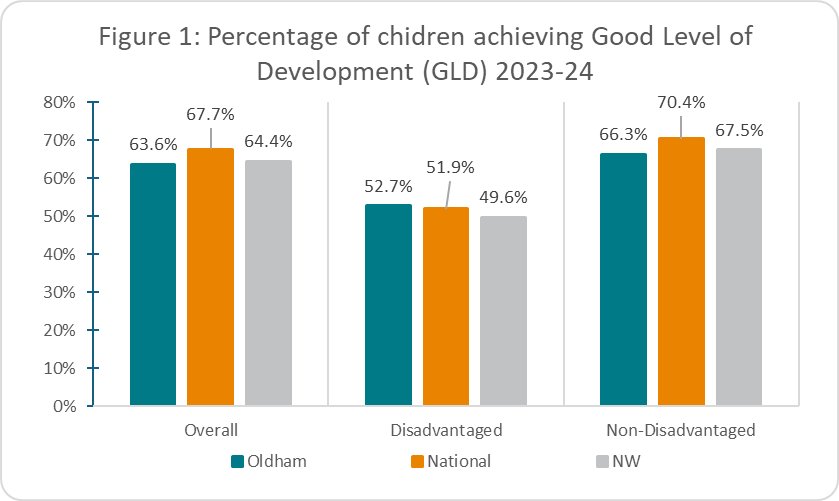
Figure 1 also shows that the most notable strength in Oldham's EYFS performance is the achievement of disadvantaged children, with 52.7% reaching GLD – 0.8 percentage points above the national average and 3.1 percentage points above the regional average. This contributes to a significantly narrower disadvantage gap in Oldham (13.6%) compared to both national (18.5%) and regional (17.9%) figures.
Despite these positives, the overall picture reflects challenges, as the performance of non-disadvantaged children (66.3%) lags behind their regional (67.5%) and national (70.4%) peers. This indicates that while Oldham is doing well for its most vulnerable children, there are concerns about outcomes for the broader population of children. Performance also remains 4.5 percentage points below pre-pandemic levels, suggesting ongoing recovery challenges.
The percentage of SEN pupils achieving a good level of development was 15.0%, which is 4.8 percentage points below the national average (19.8%) and 2.3 percentage points below the North West average (17.3%), highlighting particular challenges for children with special educational needs in Oldham's early years settings.
Year 1 Phonics: Phonics screening check - percentage meeting expected standard
Figure 2 below shows Year 1 phonics outcomes in Oldham have shown steady improvement over the past two years, reaching 77.0% in 2024 – an increase of 1.4 percentage points from 2023. While this represents progress, Oldham remains 3.2 percentage points below the national average of 80.2% and 1.9 percentage points below the North West average of 78.9%.
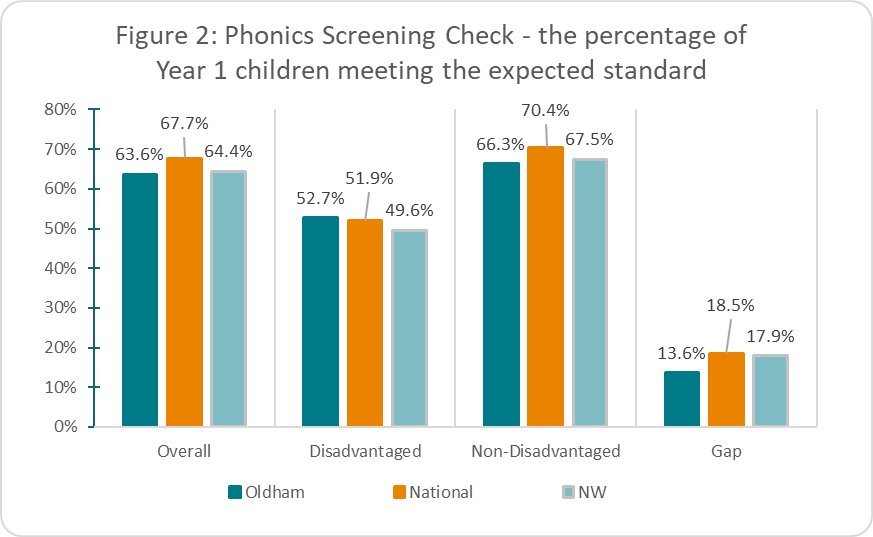
The overall trend is positive, with consistent year-on-year improvement since 2022, though performance has not yet returned to the pre-pandemic level of 79.1% achieved in 2019. Encouragingly, the gap to national and regional benchmarks has stabilised and shows signs of narrowing slightly.
A particularly positive aspect of Oldham's phonics performance is the achievement of disadvantaged pupils, with 71.0% meeting the expected standard in 2024. This is 2.7 percentage points above the national average (68.3%) and 3.2 percentage points above the regional average (67.8%). The disadvantage gap in Oldham (8.5%) is significantly smaller than both national (15.7%) and regional (15.4%) gaps, suggesting relatively effective support for disadvantaged pupils.
However, non-disadvantaged pupils in Oldham (79.5%) continue to perform below their national (83.4%) and regional (82.5%) counterparts, indicating that while the gap is smaller, this is partly due to lower performance of non-disadvantaged children rather than exclusively through raising attainment of disadvantaged pupils.
Key Stage 2 outcomes in Oldham present a concerning picture. Figure 3 below shows that in 2024, 54.4% of pupils achieved the expected standard in reading, writing and mathematics combined, representing a slight decline of 0.6 percentage points from 2023, following a more substantial improvement in the previous year. This stands in contrast to both national and regional averages, which increased by 1.3 and 0.9 percentage points respectively.

The gap to national averages has widened to 6.5 percentage points, up from 4.6 percentage points in 2023, and the performance remains significantly below the pre-pandemic level of 61.5% achieved in 2019 – a decline of 7.1 percentage points. This larger decline compared to national (-4.0%) and regional (-4.1%) figures suggests Oldham has faced greater challenges in pandemic recovery at this key stage.
Among individual subjects, mathematics shows the strongest performance relative to national averages with a gap of just 3.4 percentage points, while writing consistently shows the largest gap at 6.4 percentage points. Reading performance sits between these with a gap of around 5.0 percentage points. Writing has also shown particularly significant decline since 2019 (-10.4 percentage points), whereas reading has been relatively less affected (-1.0 percentage points).
The disadvantage gap at KS2 (17.4%) remains smaller than both national and regional figures, though this is partly due to lower non-disadvantaged performance rather than higher achievement among disadvantaged pupils. While disadvantaged pupils have shown a slight improvement from 2023 (+0.5 percentage points), non-disadvantaged pupils have seen a decline (-1.2 percentage points).
SEN and EHCP performance at KS2 presents significant challenges. The percentage of SEN pupils achieving expected standards in RWM is 15.2%, showing a decline of 2.5 percentage points from 2023, though still maintaining improvement from 2022 levels. The gap to national averages has widened substantially, from +1.7 percentage points pre-pandemic to -6.4 percentage points in 2024, indicating particularly concerning outcomes for pupils with SEND in Oldham.
Key Stage 4 Outcomes: Attainment 8 Scores
Key Stage 4 performance in Oldham presents a more positive picture compared to other key stages, particularly when comparing to 2019 pre-pandemic baselines. Figure 4 below shows Oldham's overall Attainment 8 score stands at 42.4 in 2024, which represents a slight increase of 0.3 points from the 2019 figure of 42.1. While there has been a decline from the peaks seen during the pandemic years of 2020 and 2021, this pattern is consistent with national trends reflecting the return to normal examination arrangements.
Key Stage 4 performance in Oldham presents a more positive picture compared to other key stages, particularly when comparing to 2019 pre-pandemic baselines. Figure 4 below shows Oldham's overall Attainment 8 score stands at 42.4 in 2024, which represents a slight increase of 0.3 points from the 2019 figure of 42.1. While there has been a decline from the peaks seen during the pandemic years of 2020 and 2021, this pattern is consistent with national trends reflecting the return to normal examination arrangements.

Significantly, the gap between Oldham and national averages has narrowed from 4.7 points in 2019 to 3.7 points in 2024, representing a positive reduction of 1.0 point. The gap to regional averages has narrowed even more substantially, from 3.4 points to 1.9 points, a reduction of 1.5 points. This suggests that relative to comparators, Oldham's secondary schools have made progress despite the challenges of the pandemic.
The percentage of pupils achieving grade 5 or above in both English and mathematics has improved significantly, rising from 35.3% in 2019 to 40.0% in 2024 – an increase of 4.7 percentage points. The gap to national averages has narrowed from 8.1 percentage points to 6.2 percentage points, and the gap to regional averages has reduced from 5.8 percentage points to 2.5 percentage points.
Performance for disadvantaged pupils shows more mixed results. Attainment 8 scores for this group have declined from 36.1 in 2019 to 34.2 in 2024, a reduction of 1.9 points, likely reflecting the disproportionate impact of the pandemic on disadvantaged communities. However, the percentage achieving grade 5+ in English and mathematics has improved slightly from 23.4% to 24.3% over the same period.
Similarly, SEN and EHCP pupils show mixed outcomes. Attainment 8 scores have declined slightly from 31.2 in 2019 to 30.1 in 2024, but the percentage achieving grade 5+ in English and mathematics has improved from 15.2% to 16.2%.
The data reveals a mixed picture across different educational phases. Early years and phonics show encouraging trends with narrower disadvantage gaps than national averages, though overall performance remains below national benchmarks. Key Stage 2 performance shows some concerning trends with widening gaps to national averages. Key Stage 4 presents a more positive picture with improved Attainment 8 scores compared to 2019 and substantial narrowing of gaps to national and regional benchmarks.
A consistent theme throughout is the disproportionate impact of the pandemic on disadvantaged and SEND pupils, particularly in Oldham where higher levels of deprivation have amplified these effects. However, the data also highlights areas of strength, including better-than-national performance for disadvantaged children in Early Years and relatively small disadvantage gaps in phonics and Key Stage 2.
Further Information & Resources
Early years foundation stage profileResults for the 2023 to 2024 academic year at national and local authority level.
Phonics Year 1 Screening Check
For further data and information relating to phonics Year 1 screening.
Key Stage 2 attainment: Reading, Writing and Mathematics (Combined)
For further data and information relating to Key Stage 2 attainment outcomes.
Key Stage 4: Attainment 8 scores
For further data and information relating to Key Stage 4: Attainment 8 scores.