Loading...


Childhood obesity
Introduction
There is concern about the rise of childhood obesity and the implications of obesity persisting into adulthood. The risk of obesity in adulthood and risk of future obesity-related ill health are greater as children get older. Studies tracking child obesity into adulthood have found that the probability of children who are overweight or living with obesity becoming overweight or obese adults increases with age[1,2,3]. The health consequences of childhood obesity include: increased blood lipids, glucose intolerance, Type 2 diabetes, hypertension, increases in liver enzymes associated with fatty liver, exacerbation of conditions such as asthma and psychological problems such as social isolation, low self-esteem, teasing and bullying. It is important to look at the prevalence of weight status across all weight/BMI categories to understand the whole picture and the movement of the population between categories over time [4].The World Health Organisation provides the following information relating to overweight and obesity:
The fundamental cause of obesity and overweight is an energy imbalance between calories consumed and calories expended. Globally, there has been:
- an increased intake of energy-dense foods that are high in fat and sugars; and
- an increase in physical inactivity due to the increasingly sedentary nature of many forms of work, changing modes of transportation, and increasing urbanization.
Raised BMI is a major risk factor for noncommunicable diseases such as:
- cardiovascular diseases (mainly heart disease and stroke), which were the leading cause of death in 2012;
- diabetes;
- musculoskeletal disorders (especially osteoarthritis – a highly disabling degenerative disease of the joints);
- some cancers (including endometrial, breast, ovarian, prostate, liver, gallbladder, kidney, and colon).
Childhood obesity is associated with a higher chance of obesity, premature death and disability in adulthood. But in addition to increased future risks, obese children experience breathing difficulties, increased risk of fractures, hypertension, early markers of cardiovascular disease, insulin resistance and psychological effects.
Overweight and obesity, as well as their related noncommunicable diseases, are largely preventable. Supportive environments and communities are fundamental in shaping people’s choices, by making the choice of healthier foods and regular physical activity the easiest choice (the choice that is the most accessible, available and affordable), and therefore preventing overweight and obesity.
At the individual level, people can:
- limit energy intake from total fats and sugars;
- increase consumption of fruit and vegetables, as well as legumes, whole grains and nuts; and
- engage in regular physical activity (60 minutes a day for children and 150 minutes spread through the week for adults).
The food industry can play a significant role in promoting healthy diets by:
- reducing the fat, sugar and salt content of processed foods;
- ensuring that healthy and nutritious choices are available and affordable to all consumers;
- restricting marketing of foods high in sugars, salt and fats, especially those foods aimed at children and teenagers; and
- ensuring the availability of healthy food choices and supporting regular physical activity practice in the workplace.
Source: WHO, Obesity and Overweight Fact Sheet, June 2021 [5]
National Child Measurement Programme
The National Child Measurement Programme (NCMP), established in 2006, collects annual measurements of the height and weight of over one million children in Reception (age 4-5 years) and Year 6 (age 10-11 years) in primary schools across England.The 2021 to 2022 NCMP was the first data collection since the coronavirus COVID-19 pandemic that was unaffected by school closures and other public health measures. The number of children measured in Oldham in 2021 to 2022 was 2,855 in Reception, and 3,160 in Year 6. The participation rate in Oldham in 2021 to 2022 was 85.5% in Reception children and 90.3% for children in Year 6. The participation rate in England, though high (93%), is lower than pre-pandemic years where participation had been around 95% for England since the data collection in 2014 to 2015. This is likely to be due to resourcing issues within some local authorities during the pandemic recovery process.
For population monitoring purposes body mass index (BMI) is classified according to the following image using the British 1990 growth reference (UK90) [6]. This is used to examine patterns in children’s weight status across the country and over time. The population monitoring cut points for overweight, and obesity are slightly lower than the clinical cut points used to assess individual children, this is to capture those children with an unhealthy BMI for their age and those at risk of moving to an unhealthy BMI. This helps ensure that adequate services are planned and delivered for the whole population (figure 1).
Figure 1

Data Overview
Latest data from the 2021/22 school year reveals 20.8% of reception aged children and 42.4% of year 6 aged children are classified as overweight or obese. For reception year, Oldham's prevalence falls lower than the North West (23.3%) and England (22.3%) averages. For year 6, Oldham's rate is higher than the North West (39%) and England (37.8%).Figure 2: Prevalence of overweight (incl. obesity) in Oldham for reception and year 6 aged children

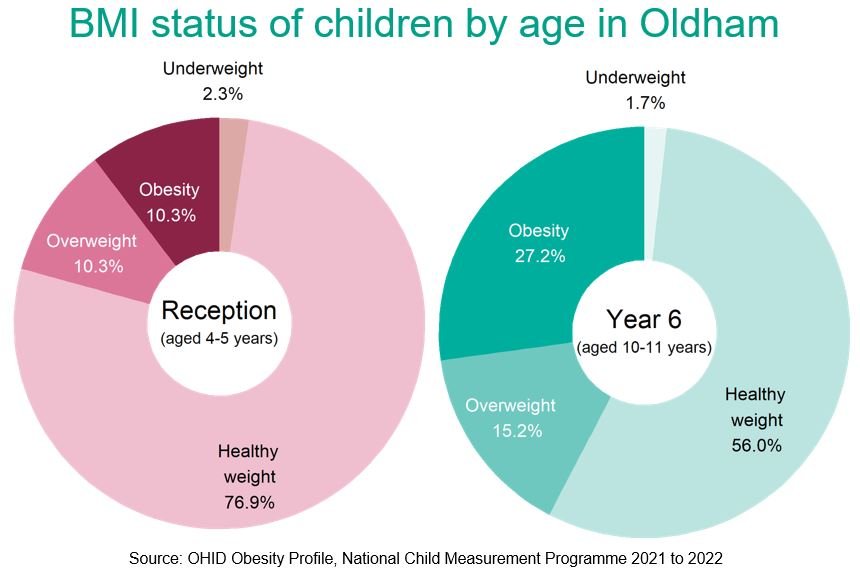
Figure 3 below shows the BMi status of children in Oldham by age according to the 2021/22 NCMP data findings. In reception, 76.9% of children in Oldham are classified as a 'healthy weight', however by the time children reach year 6 this figure has drastically dropped to just over half of children at 56%.
Figure 3: BMI status by age 2021/22
Across Greater Manchester, Oldham ranks 4th lowest for reception aged overweight and obesity at 20.8%. Rochdale ranks highest at 24.7% and Trafford lowest at 18.5% (figure 4). By the time children reach year 6, Oldham ranks 3rd highest across Greater Manchester, with 42.4% of children classified as overweight or obese. Trafford again is lowest (33.6%) and Manchester is highest (43.8%) (figure 5). Oldham has the largest percentage point difference between the reception and year 6 cohorts, with 21.6 percentage points difference. Wigan has the lowest gap at 15.8 percentage points.
Figure 4: Percentage of reception aged children classified as overweight or obese across Greater Manchester
 Source: National Child Measurement Programme
Figure 5: Percentage of year 6 aged children classified as overweight or obese across Greater Manchester
 Source: National Child Measurement Programme
The prevalence of overweight and obesity amongst reception aged children was statistically lower in 2021/22 to the North West and England averages. In 2021/22 Oldham's rate was 2.5 percentage point below the North West rate and 1.5 percentage points below the England rate. Overall prevalence levels have remained relatively stable throughout the period shown at national level, with some small decreases seen in the North West trend (-1%). Bigger fluctuations can be seen at Oldham level due to smaller numbers but the 2021/22 rate is now the same as that in 2006/07 due to the substantial decrease in rate for 2021/22. No data was published at regional level for 2006/07 due to data quality problems and no data was published for all levels for 2020/21 due to the pandemic (figure 6).
Figure 6: Percentage of reception aged children classified as overweight or obese trend
 Source: National Child Measurement Programme
In 2021/22 the prevalence of overweight and obesity amongst Year 6 age children in Oldham was statistically higher than the North West and England rates. The prevalence of overweight and obesity in Year 6 aged children has been on an increasing trend since 2006/07 across Oldham, the North West and England. Between 2006/07 and 2021/22, the prevalence rate has increased by 42.8% in Oldham compared to increases of 19.3% both regionally and nationally.
Figure 7: Percentage of year 6 aged children classified as overweight or obese trend
 Source: National Child Measurement Programme
Further Information and Resources
Oldham Council National Child Measurement Report, 2021/22Oldham Council's Data Insight & Intelligence Team produce an annual detailed report based on the National Child Measurement Programme data.
OHID Patterns and Trends in Childhood Obesity in Oldham Report
A presentation of 2021 to 2022 NCMP data at local authority level.
Childhood Obesity: A plan for Action, Chapter 2
This publication outlines the actions the government will take towards its goal of halving childhood obesity and reducing the gap in obesity between children from the most and least deprived areas by 2030.
National Child Measurement Programme Guidance
Annual guidance that advises local providers of the National Child Measurement Programme (NCMP) on how to implement it.
World Health Organisation Overweight & Obesity Fact Sheet
Information, facts and figures from the World Health Organisation relating to childhood obesity.
OHID's Obesity Data Profile
Additional data and information relating to childhood obesity and the National Child Measurement Programme findings.
Tackling obesity: empowering adults and children to live healthier lives
Tackling Obesity Policy Paper, July 2020.
Active Lives Children & Young People November 2021-22 Report
This report presents data from the Active Lives Children and Young People Survey for the academic year 2021-22. Data is presented for children and young people in school Years 1-11 (ages 5-16) in England.
References
[1] Guo SS, Chumlea WC. Tracking of body mass index in children in relation to overweight in adulthood. The American Journal of Clinical Nutrition 1999;70(suppl): 145S-8S.[2] Serdula MK, Ivery D, Coates RJ, Freedman DS, Williamson DF, Byers T. Do obese children become obese adults? A review of the literature. Preventative Medicine 1993;22:167-77.
[3] Starc G, Strel J. Tracking excess weight and obesity from childhood to young adulthood: a 12-year prospective cohort study in Slovenia. Public Health Nutrition 2011;14:49-55.
[4] OHID Obesity Profiles, accessed September 2023.
[5] World Health Organisation Overweight and Obesity Factsheet https://www.who.int/news-room/fact-sheets/detail/obesity-and-overweight
[6] Cole TJ, Freeman JV, Preece MA. Body mass index reference curves for the UK, 1990. Archives of Disease in Childhood 1995 73:25-29