Loading...

Religion and belief
Introduction
As part of the 2021 Census, data was published on religion and belief at local and national levels. The data for religion asked a voluntary question on which religious group an individual identifies themself as belonging to. The data for religion did not attempt to collect detailed information such as the extent to which they practise their religion.
Data Overview
Oldham is culturally diverse with many different religions and faiths practised in the borough. In 2021, 108,720 (44.9%) recorded themselves as Christian. This is a decrease from 59.7% of the population in 2011.
The second largest group are those who identify themselves as Muslim. In 2021, 59,031 (24.4%) recorded themselves as Muslim. This is an increase from 17.7% of the population in 2011.
Figure 1: Stated Religion in Oldham (2001-2021)
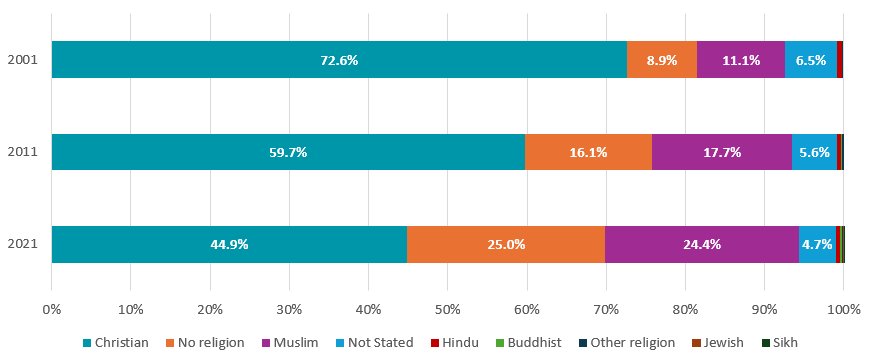 Source: Office for National Statistics (ONS), Census 2021, 2011 & 2001
The decrease in those identifying as Christian as well as those identifying as having no religion is also seen nationally.
The 2021 Census was also the first Census in which less than half of the England population (46.3%) identified as Christian. This was a decrease from n% in 2011.
Figure 2: Stated Religion in Oldham, GM and England (2021)
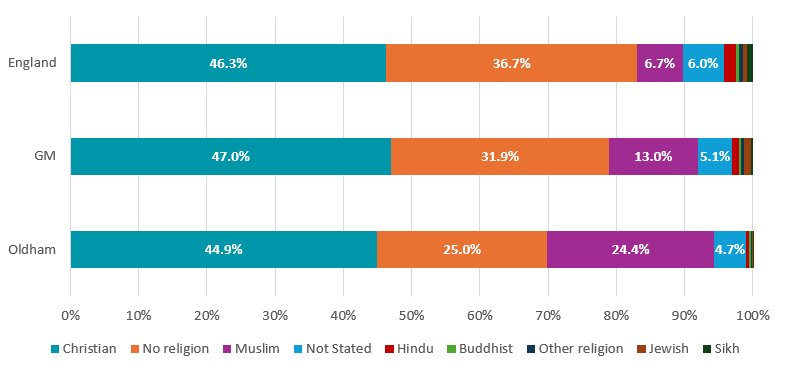 Source: Office for National Statistics (ONS), Census 2021
Figure 3: Religion in Oldham by Electoral Ward
Source: Office for National Statistics - Census 2021
ONS Census 2021 - Religion
As part of the 2021 Census, data was published on religion and belief at local and national levels. The data for religion asked a voluntary question on which religious group an individual identifies themself as belonging to. The data for religion did not attempt to collect detailed information such as the extent to which they practise their religion.
Data Overview
Oldham is culturally diverse with many different religions and faiths practised in the borough. In 2021, 108,720 (44.9%) recorded themselves as Christian. This is a decrease from 59.7% of the population in 2011.
The second largest group are those who identify themselves as Muslim. In 2021, 59,031 (24.4%) recorded themselves as Muslim. This is an increase from 17.7% of the population in 2011.
Figure 1: Stated Religion in Oldham (2001-2021)
Source: Office for National Statistics (ONS), Census 2021, 2011 & 2001The decrease in those identifying as Christian as well as those identifying as having no religion is also seen nationally.
The 2021 Census was also the first Census in which less than half of the England population (46.3%) identified as Christian. This was a decrease from n% in 2011.
Figure 2: Stated Religion in Oldham, GM and England (2021)
Source: Office for National Statistics (ONS), Census 2021Figure 3: Religion in Oldham by Electoral Ward
| Ward | Total Population | Christian | Muslim | No religion | Religion Not Stated | Christian % | Muslim % | No Religion % | Religion Not Stated % |
| Alexandra | 14449 | 4598 | 6108 | 2896 | 705 | 31.8% | 42.3% | 20.0% | 4.9% |
| Chadderton Central | 11707 | 4071 | 4608 | 2357 | 561 | 34.8% | 39.4% | 20.1% | 4.8% |
| Chadderton North | 10925 | 6276 | 1133 | 2881 | 504 | 57.4% | 10.4% | 26.4% | 4.6% |
| Chadderton South | 12589 | 6488 | 1334 | 3971 | 619 | 51.5% | 10.6% | 31.5% | 4.9% |
| Coldhurst | 15198 | 3066 | 9912 | 1465 | 581 | 20.2% | 65.2% | 9.6% | 3.8% |
| Crompton | 9923 | 6518 | 297 | 2637 | 392 | 65.7% | 3.0% | 26.6% | 4.0% |
| Failsworth East | 10364 | 6297 | 152 | 3376 | 481 | 60.8% | 1.5% | 32.6% | 4.6% |
| Failsworth West | 11103 | 6567 | 253 | 3664 | 509 | 59.1% | 2.3% | 33.0% | 4.6% |
| Hollinwood | 12923 | 5631 | 2072 | 4496 | 556 | 43.6% | 16.0% | 34.8% | 4.3% |
| Medlock Vale | 14262 | 4533 | 5741 | 2901 | 727 | 31.8% | 40.3% | 20.3% | 5.1% |
| Royton North | 11065 | 7182 | 241 | 3087 | 492 | 64.9% | 2.2% | 27.9% | 4.4% |
| Royton South | 10296 | 6078 | 675 | 2980 | 487 | 59.0% | 6.6% | 28.9% | 4.7% |
| Saddleworth North | 9884 | 5908 | 93 | 3349 | 456 | 59.8% | 0.9% | 33.9% | 4.6% |
| Saddleworth South | 9963 | 6034 | 68 | 3309 | 469 | 60.6% | 0.7% | 33.2% | 4.7% |
| Saddleworth West & Lees | 11082 | 6805 | 221 | 3464 | 487 | 61.4% | 2.0% | 31.3% | 4.4% |
| Shaw | 10037 | 5855 | 461 | 3100 | 552 | 58.3% | 4.6% | 30.9% | 5.5% |
| St James' | 12478 | 6588 | 443 | 4810 | 544 | 52.8% | 3.6% | 38.5% | 4.4% |
| St Mary's | 15035 | 2653 | 10083 | 1525 | 686 | 17.6% | 67.1% | 10.1% | 4.6% |
| Waterhead | 13790 | 5506 | 4163 | 3341 | 665 | 39.9% | 30.2% | 24.2% | 4.8% |
| Werneth | 14983 | 2073 | 10963 | 902 | 813 | 13.8% | 73.2% | 6.0% | 5.4% |
- The ward with the largest proportion of those identifying as Christian is Crompton at 65.7%.
- The ward with the largest proportion of those identifying as Muslim is Werneth at 73.2%.
- The ward with the largest proportion of those identifying with No Religion is St James' at 38.5%.
- The ward with the largest proportion of no responses is Shaw at 5.5%.
ONS Census 2021 - Religion