Loading...


Population projections
Introduction
Population projections are estimates of the population at future dates. They illustrate plausible courses of future population change based on assumptions about future births, deaths, net international migration, and net domestic migration. Projected numbers are typically based on an estimated population consistent with the most recent decennial census as, projected forward using a variant of the cohort-component method. For dates when both population estimates and projections are available, population estimates are the preferred data.
Data Overview
The total population is projected to increase to 256,380 in 2033.
Over the next ten years there will be a projected increase of:
Figure 1: Oldham's Projected Population 2011-2033.
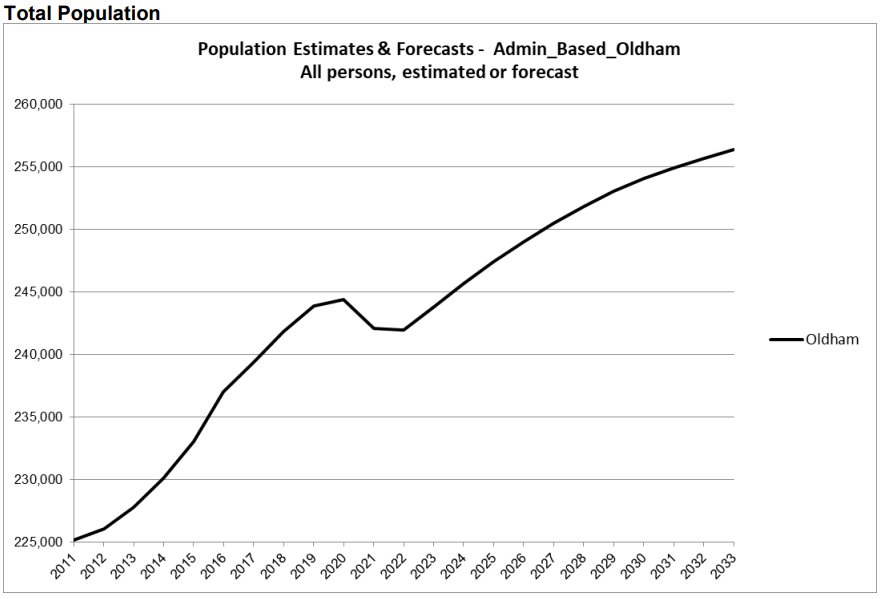
Table 1: Oldham's Projected Population 2011-2033 by Broad Age Bands
Table 2: Components of Population Change
Figure 2: Total Population Projected Change 2025-2035 by Ward/District
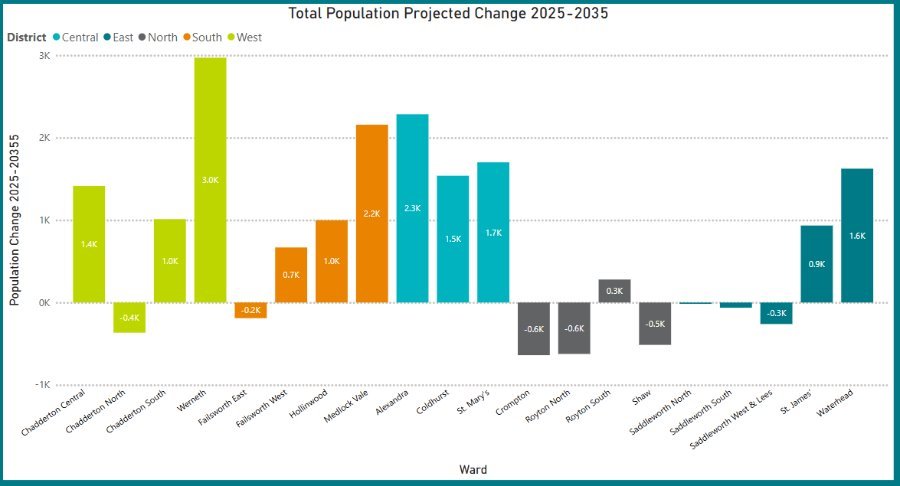
It's clear from figure 2 above that the projected increase in population is not uniform between wards and districts. With certain wards such as Chadderton North, Crompton and Shaw seeing a projected decrease in the population from 2025 to 2035.
Further Information & Resources:
Population projections are estimates of the population at future dates. They illustrate plausible courses of future population change based on assumptions about future births, deaths, net international migration, and net domestic migration. Projected numbers are typically based on an estimated population consistent with the most recent decennial census as, projected forward using a variant of the cohort-component method. For dates when both population estimates and projections are available, population estimates are the preferred data.
Data Overview
The total population is projected to increase to 256,380 in 2033.
Over the next ten years there will be a projected increase of:
- 3.2% in those aged under 64.
- 14% in those aged 65-84
- 27.8% in those aged over 85.
These projected increases show the significant challenges the council could face particularly with adult social care and health provision.
Figure 1: Oldham's Projected Population 2011-2033.
Table 1: Oldham's Projected Population 2011-2033 by Broad Age Bands
| Estimated and Forecast Population at mid-year | ||||||||
| Year | 0-4 | 5-15 | 16-24 | 25-44 | 45-64 | 65-84 | 85+ | Total |
| 2011 | 16,460 | 33,910 | 26,600 | 59,940 | 55,100 | 28,940 | 4,210 | 225,160 |
| 2012 | 16,550 | 34,210 | 26,310 | 59,680 | 55,020 | 30,080 | 4,230 | 226,080 |
| 2013 | 16,610 | 34,650 | 26,230 | 59,770 | 55,180 | 31,110 | 4,280 | 227,840 |
| 2014 | 16,790 | 35,160 | 26,100 | 60,150 | 55,870 | 31,710 | 4,330 | 230,120 |
| 2015 | 16,940 | 35,790 | 26,400 | 60,680 | 56,720 | 32,230 | 4,300 | 233,050 |
| 2016 | 17,040 | 36,390 | 26,660 | 61,940 | 58,010 | 32,560 | 4,410 | 237,020 |
| 2017 | 17,090 | 36,990 | 26,820 | 62,320 | 58,770 | 32,950 | 4,490 | 239,430 |
| 2018 | 17,010 | 37,600 | 26,940 | 63,150 | 59,180 | 33,450 | 4,530 | 241,850 |
| 2019 | 16,830 | 38,130 | 27,210 | 63,980 | 59,300 | 33,850 | 4,630 | 243,910 |
| 2020 | 16,370 | 38,570 | 27,480 | 64,030 | 59,320 | 34,050 | 4,590 | 244,420 |
| 2021 | 16,000 | 38,980 | 26,920 | 62,980 | 58,590 | 34,400 | 4,210 | 242,090 |
| 2022 | 15,710 | 38,540 | 27,100 | 63,210 | 58,570 | 34,470 | 4,350 | 241,950 |
| 2023 | 15,560 | 38,490 | 28,000 | 63,860 | 58,770 | 34,700 | 4,430 | 243,810 |
| 2024 | 15,480 | 38,340 | 28,850 | 64,410 | 59,050 | 35,040 | 4,520 | 245,680 |
| 2025 | 15,490 | 38,110 | 29,600 | 64,760 | 59,390 | 35,490 | 4,590 | 247,430 |
| 2026 | 15,580 | 37,700 | 30,340 | 65,100 | 59,690 | 35,990 | 4,640 | 249,040 |
| 2027 | 15,460 | 37,510 | 30,790 | 65,590 | 59,930 | 36,540 | 4,690 | 250,520 |
| 2028 | 15,470 | 37,240 | 31,180 | 65,890 | 60,280 | 37,000 | 4,800 | 251,850 |
| 2029 | 15,470 | 36,890 | 31,580 | 66,120 | 60,470 | 37,550 | 4,950 | 253,030 |
| 2030 | 15,450 | 36,530 | 31,850 | 66,280 | 60,700 | 38,210 | 5,040 | 254,060 |
| 2031 | 15,420 | 36,170 | 32,030 | 66,410 | 61,000 | 38,820 | 5,100 | 254,950 |
| 2032 | 15,370 | 35,820 | 32,060 | 66,420 | 61,420 | 39,160 | 5,420 | 255,680 |
| 2033 | 15,340 | 35,480 | 32,030 | 66,470 | 61,850 | 39,570 | 5,660 | 256,380 |
Table 2: Components of Population Change
| Components of Change | |||||
| Year | Births | Deaths | Net Migration | TFR | SMR |
| 2011-12 | 3,255 | 2,023 | -311 | 2.19 | 125 |
| 2012-13 | 3,279 | 1,982 | 463 | 2.19 | 121 |
| 2013-14 | 3,303 | 2,064 | 1040 | 2.17 | 124 |
| 2014-15 | 3,321 | 2,209 | 1824 | 2.14 | 131 |
| 2015-16 | 3,322 | 2,154 | 2802 | 2.08 | 127 |
| 2016-17 | 3,317 | 2,097 | 1188 | 2.03 | 122 |
| 2017-18 | 3,240 | 2,123 | 1302 | 1.95 | 121 |
| 2018-19 | 3,208 | 2,102 | 958 | 1.91 | 117 |
| 2019-20 | 3,077 | 2,431 | -136 | 1.82 | 133 |
| 2020-21 | 2,948 | 2,334 | -2945 | 1.77 | 127 |
| 2021-22 | 3,197 | 2,320 | -1019 | 1.95 | 128 |
| 2022-23 | 2,991 | 2,278 | 1150 | 1.82 | 125 |
| 2023-24 | 3,012 | 2,294 | 1150 | 1.82 | 125 |
| 2024-25 | 3,030 | 2,319 | 1035 | 1.81 | 125 |
| 2025-26 | 3,043 | 2,347 | 920 | 1.80 | 125 |
| 2026-27 | 3,052 | 2,380 | 805 | 1.80 | 125 |
| 2027-28 | 3,058 | 2,418 | 690 | 1.79 | 125 |
| 2028-29 | 3,062 | 2,455 | 575 | 1.79 | 125 |
| 2029-30 | 3,063 | 2,490 | 460 | 1.78 | 125 |
| 2030-31 | 3,062 | 2,523 | 345 | 1.78 | 125 |
| 2031-32 | 3,060 | 2,555 | 230 | 1.77 | 125 |
| 2032-33 | 3,058 | 2,588 | 230 | 1.77 | 125 |
Figure 2: Total Population Projected Change 2025-2035 by Ward/District
It's clear from figure 2 above that the projected increase in population is not uniform between wards and districts. With certain wards such as Chadderton North, Crompton and Shaw seeing a projected decrease in the population from 2025 to 2035.
Further Information & Resources: