Loading...
Total population
Introduction
Mid-year population estimates for England and Wales are produced annually by the office for national statistics (ONS). Mid-year population estimates relate to the usually resident population and account for long-term international migrants but not short-term international migrants.
Data Overview
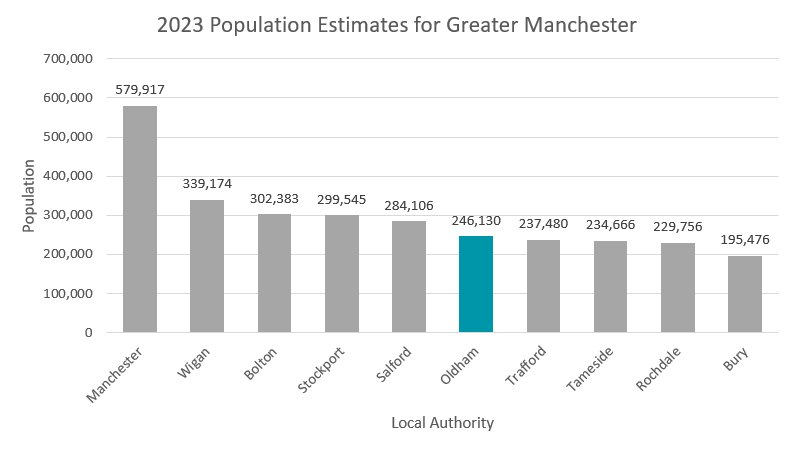
According to the 2023 mid-year population estimates, the usual resident population of Oldham is approximately 246,130. This represents an increase of 0.9% since the 2022 mid-year estimates. The largest increase was in Manchester at 2.3% and the smallest increase was in Trafford at 0.4%.
The age structure of Oldham is relatively youthful with a high proportion of residents aged under 18 (22.7%). Since 2001, the population across Oldham and England has aged, with more people aged over 65 and fewer under 18s. This change has been influenced by a decrease in the birth rate and an increase in the average life expectancy. A full breakdown is as follows:
Figure 1 below shows population estimates for Greater Manchester for 2023.
Figure 1: 2023 Population Estimates for Greater Manchester

Table 1: 2023 Mid-Year Population Estimates by Sex and Five-Year Age Bands - Oldham
Table 2: 2023 mid-year population estimates by broad age bands and sex.
Population Pyramids:
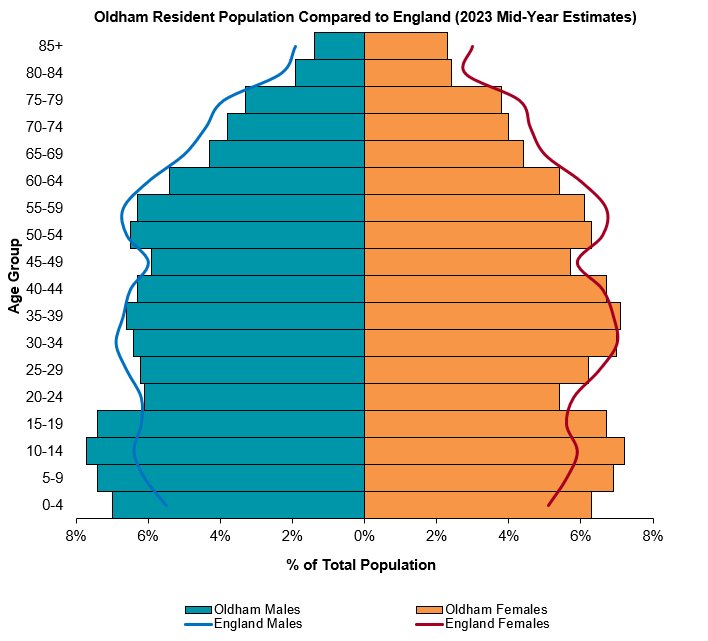
Oldham's population pyramid (Figure 4 below) shows the differences between five-year age bands for both Oldham and England.
It's clear from the population pyramid that Oldham has a significantly younger population than England
Figure 4: Population Pyramid for Oldham and England (2023 Mid-Year Estimates)

Further Information & Resources:
ONS Mid-Year Population Estimates Data Release
Mid-year population estimates for England and Wales are produced annually by the office for national statistics (ONS). Mid-year population estimates relate to the usually resident population and account for long-term international migrants but not short-term international migrants.
Data Overview
According to the 2023 mid-year population estimates, the usual resident population of Oldham is approximately 246,130. This represents an increase of 0.9% since the 2022 mid-year estimates. The largest increase was in Manchester at 2.3% and the smallest increase was in Trafford at 0.4%.
The age structure of Oldham is relatively youthful with a high proportion of residents aged under 18 (22.7%). Since 2001, the population across Oldham and England has aged, with more people aged over 65 and fewer under 18s. This change has been influenced by a decrease in the birth rate and an increase in the average life expectancy. A full breakdown is as follows:
- 22.7% aged under 18
- 61.4% aged 18-64
- 15.9% aged 65+
Figure 1 below shows population estimates for Greater Manchester for 2023.
Figure 1: 2023 Population Estimates for Greater Manchester

Table 1: 2023 Mid-Year Population Estimates by Sex and Five-Year Age Bands - Oldham
| Male | Female | Total | % | |
| Aged 0-4 years | 8,391 | 7,859 | 16,250 | 6.6% |
| Aged 5 - 9 years | 8,979 | 8,603 | 17,582 | 7.1% |
| Aged 10 - 14 years | 9,251 | 9,056 | 18,307 | 7.4% |
| Aged 15 - 19 years | 8,969 | 8,395 | 17,364 | 7.1% |
| Aged 20 - 24 years | 7,337 | 6,798 | 14,135 | 5.7% |
| Aged 25 - 29 years | 7,526 | 7,825 | 15,351 | 6.2% |
| Aged 30 - 34 years | 7,689 | 8,795 | 16,484 | 6.7% |
| Aged 35 - 39 years | 7,976 | 8,951 | 16,927 | 6.9% |
| Aged 40 - 44 years | 7,633 | 8,427 | 16,060 | 6.5% |
| Aged 45 - 49 years | 7,110 | 7,090 | 14,200 | 5.8% |
| Aged 50 - 54 years | 7,791 | 7,953 | 15,744 | 6.4% |
| Aged 55 - 59 years | 7,593 | 7,644 | 15,237 | 6.2% |
| Aged 60 - 64 years | 6,510 | 6,795 | 13,305 | 5.4% |
| Aged 65 - 69 years | 5,237 | 5,500 | 10,737 | 4.4% |
| Aged 70 - 74 years | 4,633 | 5,068 | 9,701 | 3.9% |
| Aged 75 - 79 years | 4,018 | 4,758 | 8,776 | 3.6% |
| Aged 80 - 84 years | 2,306 | 3,061 | 5,367 | 2.2% |
| Aged 85 and over | 1,725 | 2,878 | 4,603 | 1.9% |
| All Ages | 120,674 | 125,456 | 246,130 |
Table 2: 2023 mid-year population estimates by broad age bands and sex.
| Geography | Total Population | Male | Female | Aged 0-15 Years | Aged 16-64 Years | Aged 65+ Years | |||
| Number | Number | Number | Number | % | Number | % | Number | % | |
| Oldham | 246,130 | 120,674 | 125,456 | 55,799 | 22.7% | 151,147 | 61.4% | 39,184 | 15.9% |
| Greater Manchester | 2,948,633 | 1,456,651 | 1,491,982 | 597,027 | 20.2% | 1,886,326 | 64.0% | 465,280 | 15.8% |
| England | 57,690,323 | 28,283,074 | 29,407,249 | 10,648,350 | 18.5% | 36,258,886 | 62.9% | 10,783,087 | 18.7% |
Population Pyramids:
Oldham's population pyramid (Figure 4 below) shows the differences between five-year age bands for both Oldham and England.
It's clear from the population pyramid that Oldham has a significantly younger population than England
Figure 4: Population Pyramid for Oldham and England (2023 Mid-Year Estimates)

Further Information & Resources:
ONS Mid-Year Population Estimates Data Release

