Loading...
Inequality
Introduction
Inequalities looks at unfair and avoidable differences in health status across residents of Oldham and between different groups within Oldham. This can include how long people are likely to live, care that is available to residents and the health conditions they may experience.
Data Overview:
There are many different ways to view health inequalities across Oldham. For example, those living in the most deprived areas of Oldham can expect to live shorter lives than those living in the most affluent areas of Oldham.
Between Alexandra (The 2nd most deprived ward) and Saddleworth South (The least deprived ward) there is a difference of:
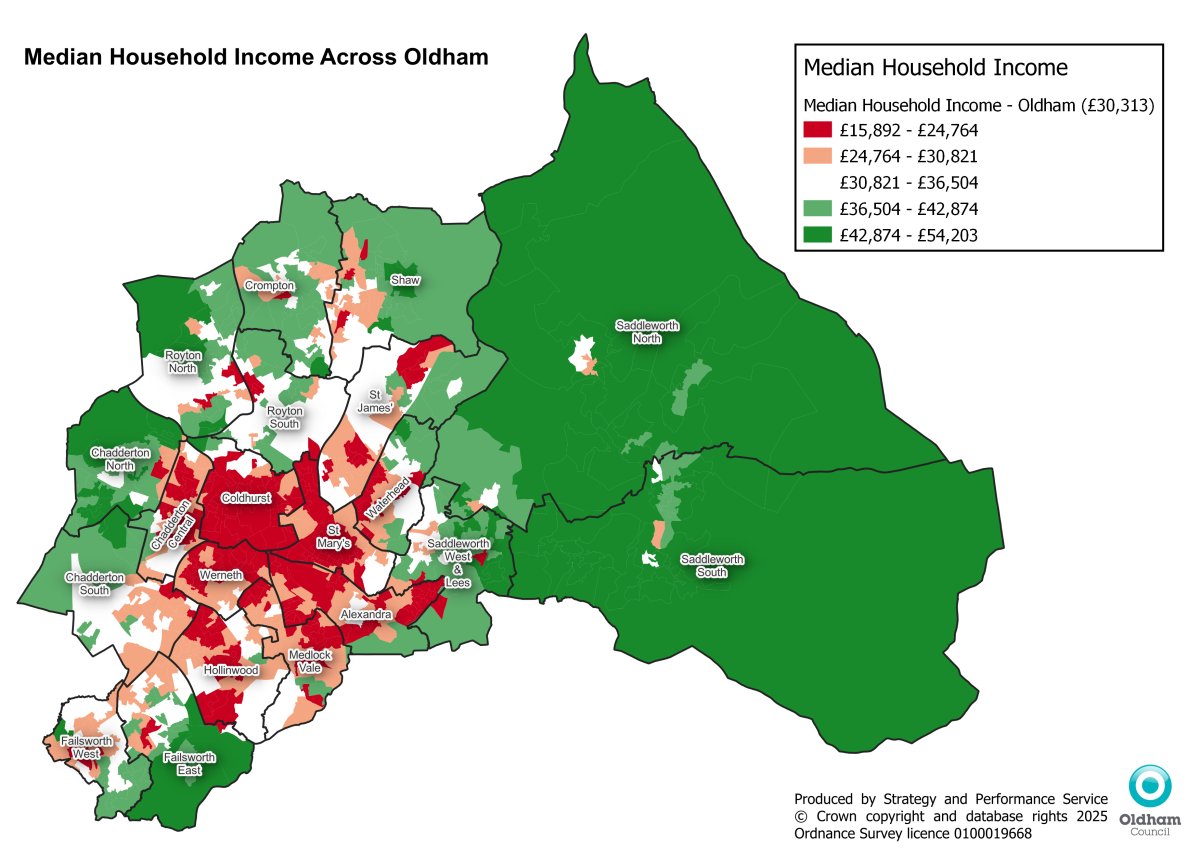
There is also significant variance for median household income by the wards of Oldham.
Table 1: Median Household Income by Ward
Source: CACI Paycheck (2024)
The difference in median household income between the most affluent ward (Saddleworth South) and the most deprived ward (Coldhurst) is £23,586.
Figure 1: Map of Median Household Income Across Oldham

Further Information & Resources:
Inequalities looks at unfair and avoidable differences in health status across residents of Oldham and between different groups within Oldham. This can include how long people are likely to live, care that is available to residents and the health conditions they may experience.
Data Overview:
There are many different ways to view health inequalities across Oldham. For example, those living in the most deprived areas of Oldham can expect to live shorter lives than those living in the most affluent areas of Oldham.
Between Alexandra (The 2nd most deprived ward) and Saddleworth South (The least deprived ward) there is a difference of:
- 12.7 years for Males
- 12.8 years for Females
There is also significant variance for median household income by the wards of Oldham.
Table 1: Median Household Income by Ward
| Ward | Median Income |
| Alexandra | £23,802 |
| Chadderton Central | £27,856 |
| Chadderton North | £38,412 |
| Chadderton South | £31,611 |
| Coldhurst | £21,208 |
| Crompton | £34,971 |
| Failsworth East | £33,787 |
| Failsworth West | £31,944 |
| Hollinwood | £26,655 |
| Medlock Vale | £26,673 |
| Royton North | £34,637 |
| Royton South | £34,118 |
| Saddleworth North | £44,210 |
| Saddleworth South | £44,794 |
| Saddleworth West & Lees | £38,174 |
| Shaw | £33,066 |
| St James' | £28,729 |
| St Mary's | £23,141 |
| Waterhead | £27,809 |
| Werneth | £24,037 |
The difference in median household income between the most affluent ward (Saddleworth South) and the most deprived ward (Coldhurst) is £23,586.
Figure 1: Map of Median Household Income Across Oldham

Further Information & Resources:

