Loading...


Ethnicity
Introduction
Oldham is a diverse borough with many residents from ethnic minority backgrounds.
Data Overview
The only ethnic group that has reduced in size since 2011 is the white population. This has fallen from 174,326 in 2011 to 164,897 in 2021, a decrease of 5.4%. This decrease is a natural decline in the population.
There was significant growth within the black population going from 2,797 in 2011 to 8,209 in 2021. The population growth within the black population is largely driven by migration to the UK from Africa, particularly Nigeria.
There was also continued growth within the Bangladeshi and Pakistani populations now accounting for 22.5% of Oldham's total population. The growth in these populations has been driven by a younger age profile, higher birth rates and migration.
Figure 1: Oldham's Ethnic Population Over Time
Source: Office for National Statistics (ONS) Census 2021
Figure 2: Population Change by Ethnic Group - Oldham, GM & England
Source: Office for National Statistics (ONS) Census 2021
Figure 3: Ethnic Groups by Ward
Source: Office for National Statistics (ONS) Census 2021
Figure 3 shows a breakdown of the three most populated ethnic groups in Oldham at ward level based on 2021 Census data. There is a clear geographical pattern to minority ethnic groups being clustered in and around the central wards such as Alexandra, Werneth, Coldhurst and St Mary's.
Figure 4: Predominant Ethnic Groups Within Oldham
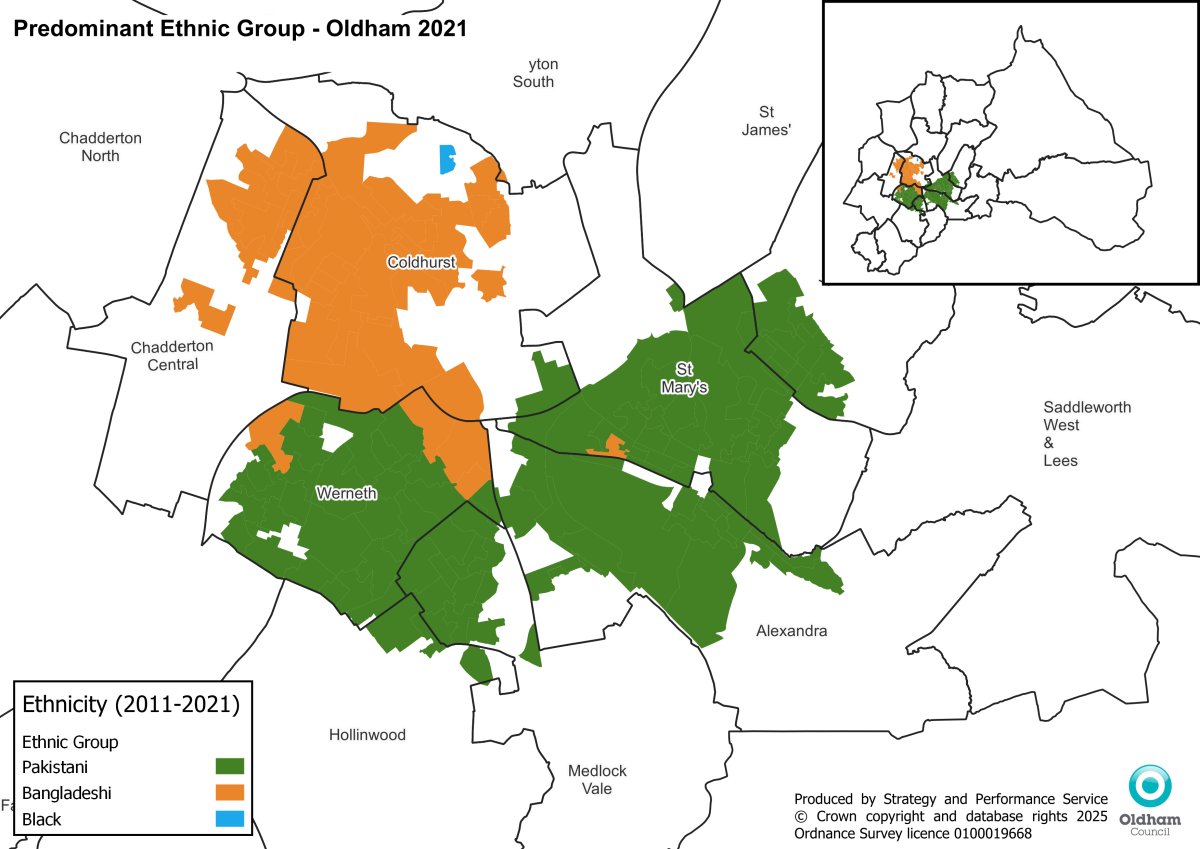
Figure 4 above shows the predominant ethnic group within each output area (OA) across Oldham.
The key points behind this data/map are:
Further Information & Resources:
ONS Census 2021 - Ethnicity Release
Oldham is a diverse borough with many residents from ethnic minority backgrounds.
Data Overview
The only ethnic group that has reduced in size since 2011 is the white population. This has fallen from 174,326 in 2011 to 164,897 in 2021, a decrease of 5.4%. This decrease is a natural decline in the population.
There was significant growth within the black population going from 2,797 in 2011 to 8,209 in 2021. The population growth within the black population is largely driven by migration to the UK from Africa, particularly Nigeria.
There was also continued growth within the Bangladeshi and Pakistani populations now accounting for 22.5% of Oldham's total population. The growth in these populations has been driven by a younger age profile, higher birth rates and migration.
Figure 1: Oldham's Ethnic Population Over Time
| Population | Percentage of Population | |||||||
| Ethnic group | 1991 | 2001 | 2011 | 2021 | 1991 | 2001 | 2011 | 2021 |
| White | 200,000 | 187,162 | 174,326 | 164,897 | 91.3 | 86.1 | 77.5 | 68.1 |
| Pakistani | 9,000 | 13,754 | 22,686 | 32,802 | 4.1 | 6.3 | 10.1 | 13.5 |
| Bangladeshi | 5,200 | 9,817 | 16,310 | 21,754 | 2.4 | 4.5 | 7.3 | 9.0 |
| Black | 1,800 | 1,235 | 2,797 | 8,209 | 0.8 | 0.6 | 1.2 | 3.4 |
| Indian | 1,600 | 1,562 | 1,555 | 1,676 | 0.7 | 0.7 | 0.7 | 0.7 |
| Chinese | 400 | 408 | 726 | 819 | 0.2 | 0.2 | 0.3 | 0.3 |
| Mixed and Other | 1,000 | 3,335 | 6,497 | 11,930 | 0.5 | 1.5 | 2.9 | 4.9 |
| All ethnic minorities | 19,000 | 29,437 | 50,571 | 84,173 | 8.7 | 13.9 | 22.5 | 31.9 |
| Total Population | 219,000 | 217,273 | 224,897 | 242,087 | 100 | 100 | 100 | 100 |
Figure 2: Population Change by Ethnic Group - Oldham, GM & England
| Oldham | GM | England | |||||||
| 2011 Census Count | 2021 Census Count | % Change since 2011 | 2011 Census Count | 2021 Census Count | % Change Since 2011 | 2011 Census Count | 2021 Census Count | % Change Since 2011 | |
| White | 174,326 | 164,897 | -5.4% | 2,248,123 | 2,190,838 | -2.5% | 45,281,142 | 45,783,401 | 1.1% |
| Pakistani | 22,686 | 32,802 | 44.6% | 130,012 | 209,061 | 60.8% | 1,112,282 | 1,570,285 | 41.2% |
| Bangladeshi | 16,310 | 21,754 | 33.4% | 34,186 | 46,460 | 35.9% | 436,514 | 629,567 | 44.2% |
| Black | 2,797 | 8,209 | 193.5% | 74,097 | 134,114 | 81.0% | 1,846,614 | 2,381,724 | 29.0% |
| Indian | 1,555 | 1,676 | 7.8% | 53,461 | 69,481 | 30.0% | 1,395,702 | 1,843,248 | 32.1% |
| Chinese | 726 | 819 | 12.8% | 26,079 | 29,582 | 13.4% | 379,503 | 431,165 | 13.6% |
| Mixed and Other | 6,497 | 11,930 | 83.6% | 116,570 | 188,216 | 61.5% | 2,560,699 | 3,850,658 | 50.4% |
| All ethnic minorities | 50,571 | 77,190 | 52.6% | 434,405 | 676,914 | 55.8% | 7,731,314 | 10,706,647 | 38.5% |
| Total Population | 224,897 | 242,087 | 7.6% | 2,682,528 | 2,867,752 | 6.9% | 53,012,456 | 56,490,048 | 6.6% |
Figure 3: Ethnic Groups by Ward
| Ward | Total Population | White | Bangladeshi | Pakistani | White % | Bangladeshi % | Pakistani % |
| Alexandra | 14449 | 6571 | 665 | 4762 | 45.5% | 4.6% | 33.0% |
| Chadderton Central | 11707 | 6116 | 3861 | 699 | 52.2% | 33.0% | 6.0% |
| Chadderton North | 10925 | 9311 | 701 | 342 | 85.2% | 6.4% | 3.1% |
| Chadderton South | 12589 | 10153 | 614 | 545 | 80.6% | 4.9% | 4.3% |
| Coldhurst | 15198 | 3430 | 8814 | 548 | 22.6% | 58.0% | 3.6% |
| Crompton | 9923 | 9335 | 182 | 99 | 94.1% | 1.8% | 1.0% |
| Failsworth East | 10364 | 9759 | 28 | 60 | 94.2% | 0.3% | 0.6% |
| Failsworth West | 11103 | 9888 | 38 | 121 | 89.1% | 0.3% | 1.1% |
| Hollinwood | 12923 | 9527 | 414 | 1343 | 73.7% | 3.2% | 10.4% |
| Medlock Vale | 14262 | 7071 | 1029 | 4193 | 49.6% | 7.2% | 29.4% |
| Royton North | 11065 | 10446 | 109 | 91 | 94.4% | 1.0% | 0.8% |
| Royton South | 10296 | 9109 | 425 | 200 | 88.5% | 4.1% | 1.9% |
| Saddleworth North | 9884 | 9585 | 4 | 48 | 97.0% | 0.0% | 0.5% |
| Saddleworth South | 9963 | 9631 | 14 | 34 | 96.7% | 0.1% | 0.3% |
| Saddleworth West & Lees | 11082 | 10519 | 30 | 162 | 94.9% | 0.3% | 1.5% |
| Shaw | 10037 | 9184 | 306 | 131 | 91.5% | 3.0% | 1.3% |
| St James' | 12478 | 10928 | 109 | 207 | 87.6% | 0.9% | 1.7% |
| St Mary's | 15035 | 3411 | 1219 | 8265 | 22.7% | 8.1% | 55.0% |
| Waterhead | 13790 | 8498 | 144 | 3721 | 61.6% | 1.0% | 27.0% |
| Werneth | 14983 | 2428 | 3043 | 7213 | 16.2% | 20.3% | 48.1% |
Figure 3 shows a breakdown of the three most populated ethnic groups in Oldham at ward level based on 2021 Census data. There is a clear geographical pattern to minority ethnic groups being clustered in and around the central wards such as Alexandra, Werneth, Coldhurst and St Mary's.
Figure 4: Predominant Ethnic Groups Within Oldham
Figure 4 above shows the predominant ethnic group within each output area (OA) across Oldham.
The key points behind this data/map are:
- The Bangladeshi population is primarily located within the ward of Coldhurst and the Busk area of Chadderton North. This also appears to be expanding in to Chadderton North.
- The Pakistani population is geographically more diverse being spread over several wards such as Werneth, Alexandra, Medlock Vale and St Mary's.
- We also now have an output area (OA) where the black population has become the predominant ethnic group.
Further Information & Resources:
ONS Census 2021 - Ethnicity Release