Loading...


Alcohol
Introduction
It is estimated that approximately 11 million adults in England (or one-fifth of the adult population) are drinking at levels that increase the risk of them developing health problems of which 1.6-1.8 million having some level of alcohol dependence. Alcohol is the third leading risk factor for death and disability, after smoking and obesity, and has been identified as a causal factor in more than 60 medical conditions including cirrhosis of the liver, heart disease, depression, pancreatitis and stroke as well as a number of cancers. Alcohol dependency can be a long-term condition and individuals may experience various health problems, placing further pressure on overstretched health services. Excessive alcohol consumption is a major cause of preventable premature death.
When analysing and interpreting Alcohol data for Oldham, the borough's demographic make-up requires a degree of consideration. The overall rates do not always provide an accurate representation of the impact of alcohol consumption, problematic alcohol use and dependency. Oldham has a growing proportion of residents from South Asian communities (25%-27% of the borough's population) of whom the majority, for religious and cultural beliefs, abstain from the consumption of alcohol. Therefore, the impact of such high abstinence levels within Oldham can mask higher rates of problematic and high-risk drinking that occurs amongst others communities across the borough.
Hospital admissions episodes for alcohol-related health conditions
Table 1.1 below shows alcohol related hospital admissions episodes and alcohol related mortality per 100,000 population amongst adults (18+) in Oldham.
Hospital admissions episodes for alcohol-related conditions for Oldham, GMCA, North West and England by sex in 2023/24 are shown in Table 1.1 below. Admissions episodes for alcohol-related cardiovascular conditions is greater (i.e. worse) in Oldham than England for both males and females. The same can observed for admissions episodes relating to alcoholic liver disease, Oldham’s performance is worse than GMCA, North West and England averages for both males and females. In relation to admissions episodes for mental and behavioural disorders due to alcohol use Oldham’s value for males are higher than GMCA, North West and England averages, whilst rates amongst females are either similar to or significantly lower (i.e. better) than other geographies shown.
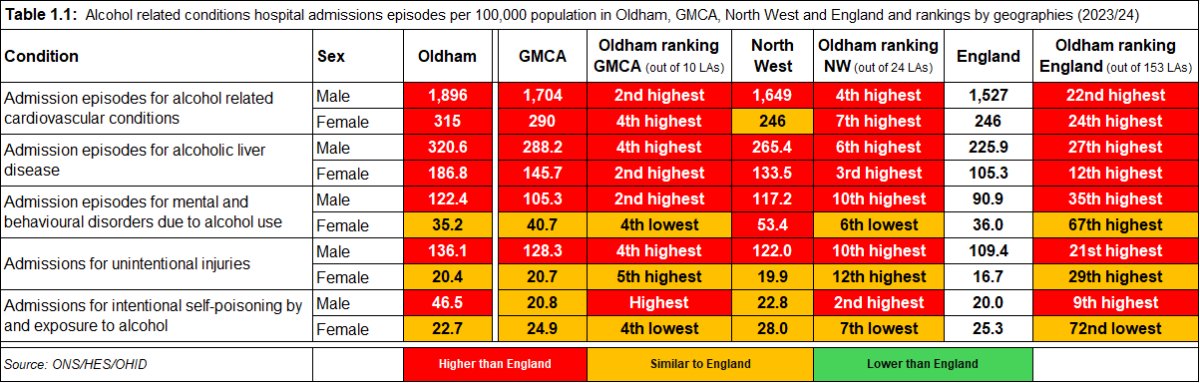
Table 1.1 above also shows admissions for unintentional injuries amongst males (136.1 per 100,000 population (up 43% in two years)) in Oldham which is greater than the England average (109.4) by 24.4%. Amongst females in Oldham, however, the rate (20.4) is similar to all other geographies. For admissions relating to ''intentional self-poisoning by and exposure to alcohol' the rate for males in Oldham (46.5 per 100,000 (up 52% in two years)) is more than double the rate of all other geographies shown (England (20.0), GMCA (20.4) and North West (22.8)) averages. Amongst females for the same condition the Oldham rate (22.7 per 100,000) is significantly lower (i.e. better) than North West (28.0) but more similar to GMCA (24.9) and England (25.3) averages.
Alcohol related mortality
In Table 1.2 below the rates per 100,000 population for alcohol-related mortality are shown for Oldham, GMCA, the North West and England. For both ‘alcohol specific mortality’ (10th highest nationally) and ‘mortality due to chronic liver disease’ (11th highest nationally) Oldham’s rates, although broadly similar to GMCA and North West averages, are far higher than those for England - by 71% and 58% respectively.
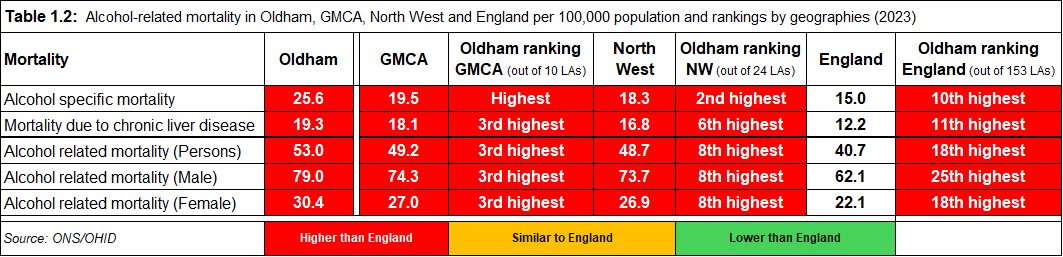
Table 1.2 also shows that the Oldham rate for ‘alcohol-related mortality’ (53.0 per 100,000) as significantly higher than the England average (40.7), as well as the averages for GMCA (49.2) and North West (48.7). Amongst males the rate for alcohol related mortality is broadly similar to GMCA and the North West but approximately 27% greater than the England average. For females the rate, again, is similar to those of the combined authority and the region but are 38% higher than the national average.
Deaths in treatment
The proportion of deaths amongst alcohol only clients in Oldham is lower than the averages for all other geographies. Oldham’s rate is the 3rd lowest out of the 10 local authorities in GMCA and 7th lowest out of the 24 authorities that make up to the North West region.Summary profile of alcohol only clients in treatment in Oldham
For those with moderate to increasing risk alcohol related issues and problems as well alcohol dependency, the analysis below provides a profile of Oldham's 'alcohol only' in-treatment population.
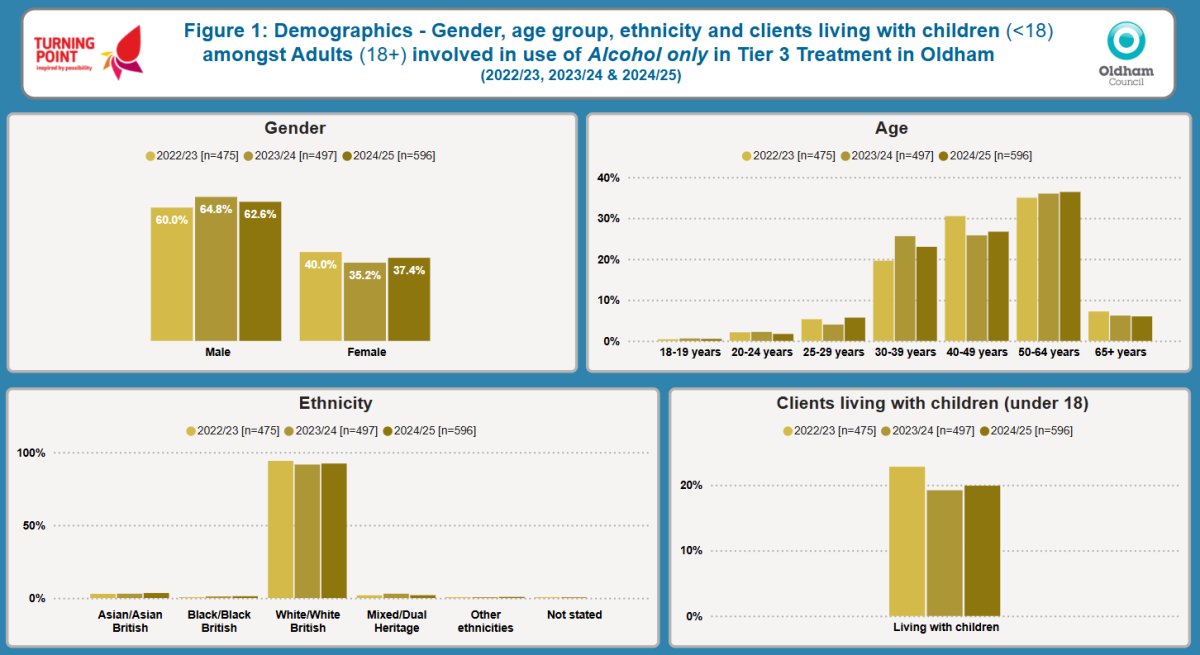
Figure 1 below contains four data visuals in relation to the demographic make-up of Oldham’s alcohol only in-treatment population from 2022/23 to 2024/25. Historically, 60%-65% of adult alcohol only users in treatment were male. Typically, approximately 95% are from White/White British ethnicities with less than 5.0% from Asian/Asian British backgrounds. The largest age cohorts are amongst those aged 40-49 and 50-64. Approximately one-fifth of alcohol only clients live with children aged 0-17 years.
Treatment journeys amongst alcohol only clients from Oldham
Figure 2 below represents the treatment journey amongst adults alcohol only clients from Oldham.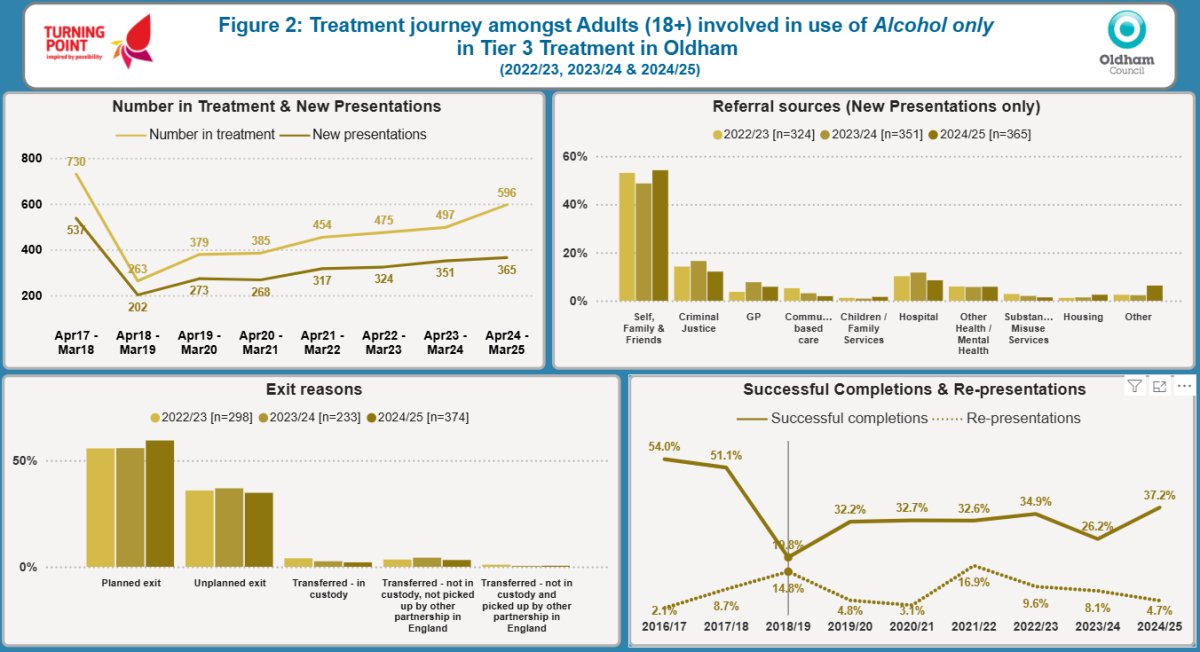
Number in treatment and new presentations
The top left-hand chart shows numbers in treatment and new presentations from April 2017/March 2018 to April 2024/March 2025. Following a sharp decrease from the earliest census period to March 2019, numbers in treatment and those newly presenting have been on an upward trend. In the most recent period the number of alcohol only clients in treatment increased by 19.9% from 497 in March 2024 to 596 in March 2025. Since March 2019, new presentations have increased by almost 81% from 202 to 365 in March 2025.
Across GM, Oldham has the fourth highest rate of alcohol only clients in treatment services with 3.58 per 1,000 of the adult population (aged 18 to 75). Tameside has the highest with 4.57 and Trafford the lowest with 2.33. Oldham’s rate is greater than the averages for GMCA (3.31 per 1,000), the North West rate (3.10) and England (2.43).
Referral sources
By far the most common source of referrals amongst this user cohort is ‘Self, Family & Friends’ which typically accounts for 49%-54% of all new presentations. In the 2024/25 ‘Criminal Justice’ accounted for approximately one in eight (12.1%) of referrals – dropping by one-quarter from 16.5% in the previous year. Referrals from ‘Hospital’ currently make up 8.5% of referrals while, at a lower level, referrals from ‘Other Health/Mental Health’ agencies have averaged around 6% over the past three years.
Treatment exits status
Figure 2 above also shows treatment exit status amongst alcohol only clients in Oldham from 2022/23 to 2024/25. It can be observed that ‘planned exits’ amongst this user cohort have increased by almost four percentage points, from 55.7% in 2022/23 to 59.4% in 2024/25. Over the same period ‘unplanned exits’ remained broadly consistent – between 35% and 37%. Those who were ‘transferred – in custody’ accounted for less than 1.0% of exits in 2024/25.
Successful completions and re-presentations
The bottom right-hand corner of Figure 2 above shows trends for successful completions of treatment and re-presentations to treatment amongst Oldham’s alcohol only clients from 2016/17 to 2024/25. It can be observed that successful completions slumped from a high of 54.0% in 2016/17 to a low of just 19.8% in 2018/19. Since then the rate of successful completions amongst this user cohort has been on an upward trajectory with 37.2% recorded for 2024/25. Oldham’s most recent rate is lower than the North West average of 39.6% but similar to the England average of 35.3%. Oldham’s rate is also similar to the GMCA average of 37.8%.
Re-presentation rates are also shown alongside successful completions. Re-presentations are defined as where an individual presents to treatment within 6 months of a successful completion of treatment and is, therefore, not considered to be a ‘new presentation’. Oldham’s performance has been characterised by fluctuating rates from a low of 2.1% in 2016/17 – its best rate – to a high of 16.9% in 2021/22. In the most recent period in 2024/25 Oldham re-presentation rate was 4.7% which is far lower than the averages for North West (10.8%) and GMCA (8.4%). Oldham had the third best rate in the North West with the lowest rate (i.e. best) across the region recorded by Cheshire West & Chester with 1.7% while the highest rate was found in Liverpool with 18.6%. Amongst the ten borough that comprise the GMCA, Oldham had the best rate while Wigan had the worst rate with 10.5%.
Monthly alcohol consumption (units) and treatment interventions amongst adult alcohol only clients in Oldham
Figure 3 below shows the units of alcohol consumed amongst adult alcohol only clients in treatment in Oldham 2022/23 to 2024/25. The proportion of this user cohort who indicated that they consumed zero units was, typically, less than 5.0%. It can be observed that those citing the consumption of ‘1-199 units’ and ‘200-399 units’ have fluctuated over the three census periods on view. Indications for ‘600-799 units’ per month have decreased over the same period.
Figure 3 above also shows that higher levels of monthly consumption have increased. This is particularly the case in relation to alcohol only clients indicating the consumption of ‘1,000+ units’ per month which has risen by more than five percentage points (which represents an increase of 25.2% in the actual number of clients indicating as such). At best ‘1,000+ units’ is the equivalent of daily consumption of almost one litre of 40% proof spirits per day or 3.64 bottles containing 750ml of 12% proof wine per day or 12.83 pints of 4.5% proof lager/beer per day.
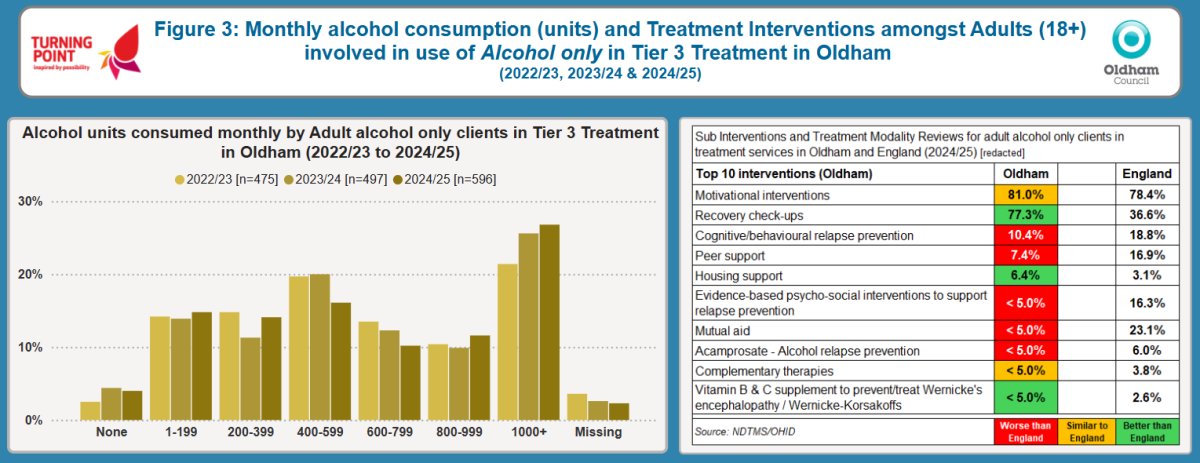
Sub-intervention reviews (SIRs)
Figure 3 above also shows a table consisting of the top ten rates for the most frequently used sub-intervention reviews amongst Oldham’s alcohol only clients in comparison to England averages. Oldham rates are worse than England’s in half of the sub-intervention reviews listed which include ‘cognitive/behavioural relapse prevention’ (10.4% in Oldham compared to 18.8% for England); ‘evidence-based psycho-social interventions to support relapse prevention’ (less than 5.0% for Oldham which is less than one-third the England average of 16.3%); and ‘peer support’ (7.4% for Oldham compared to 16.9% for England). Where Oldham is better than the national average is ‘recovery check-ups’ (77.3% compared to 36.6%); 'housing support' (6.4% compared to 3.1%) and ‘vitamin B & C supplement to prevent/treat Wernicke’s encephalopathy/Wernicke-Korsakoffs’.
Unmet treatment need and co-occurring mental health treatment need in alcohol only clients
Figure 4 below shows the rate of unmet treatment need for individuals affected by alcohol misuse and/or dependency. Oldham has a lower rate (68.2%) than the North West (74.0%) and England (75.6%) averages. However, the prevalence estimate for Oldham of the number of its residents involved in problematic alcohol consumption and not in treatment is 3,008 (or 18.07 per 1,000 of 18+ population). This is slightly lower than the North West rate of 18.75 but 21.5% greater than the national rate of 14.87 (per 1,000).
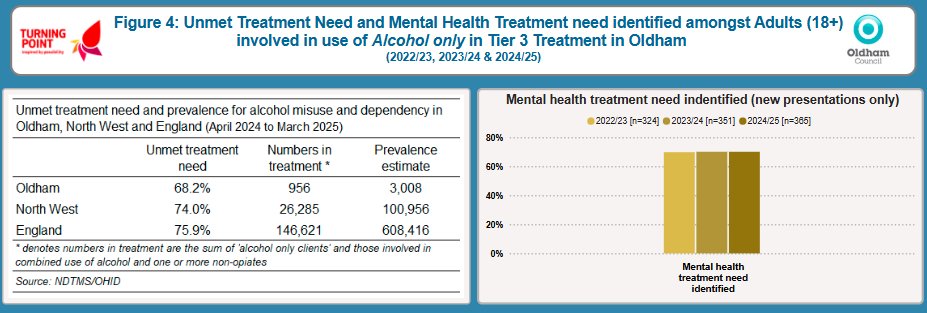
Figure 4 above also shows that co-occurring identified mental health treatment needs were typically around 70% of clients from 2022/23 to 2024/25.
Further Information & Resources
Oldham Drug & Alcohol Needs Assessment 2022This Needs Assessment has been compiled in order to provide detailed analysis and information with regards to both past and current performance of drug and alcohol treatment provision in Oldham.
OHID Local Alcohol Data Profiles
More data and information is available on OHID's (fingertips) Local Alcohol Data Profile.