Loading...


Cancer
Introduction
- There are more than 385,000 new cancer cases in the UK every year (2017-19).
- Breast, prostate, lung, and bowel cancers together accounted for over half (53%) of all new cancer cases in the UK in 2017-2019.
- Each year more than a third (36%) of all new cancer cases (excluding non-melanoma skin cancers) in the UK are diagnosed in people aged 75 and over (2017-2019).
- There are around 167,000 cancer deaths in the UK every year, that's nearly 460 every day (2017-2019).
- Half (50%) of people diagnosed with cancer in England and Wales survive their disease for ten years or more (2010-11).
- A person’s risk of developing cancer depends on many factors, including age, genetics, and exposure to risk factors.
- 38% of cancers are considered preventable (2015) [1].
- breast cancer
- lung cancer
- prostate cancer
- bowel cancer
Data Overview
Incidence
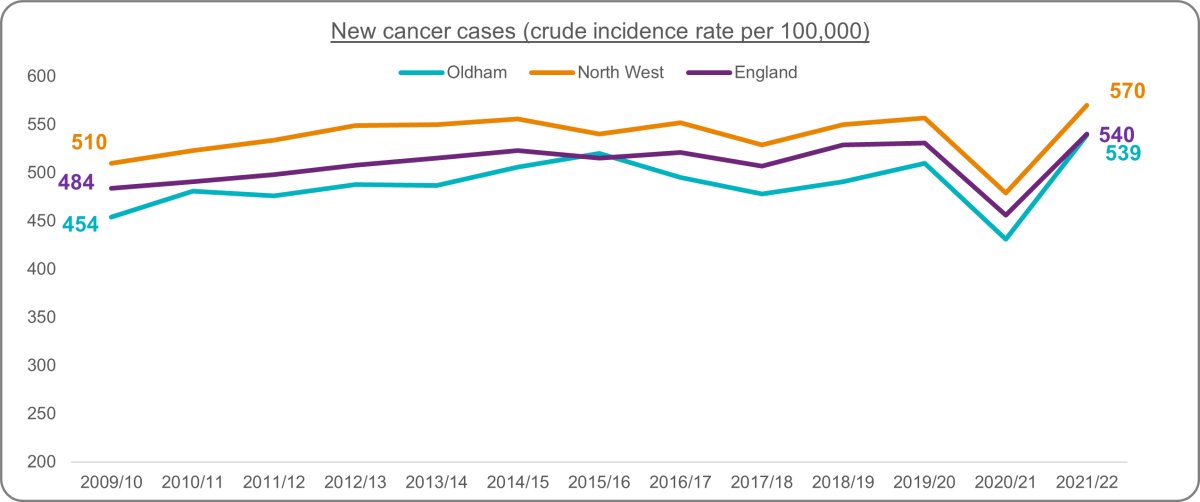
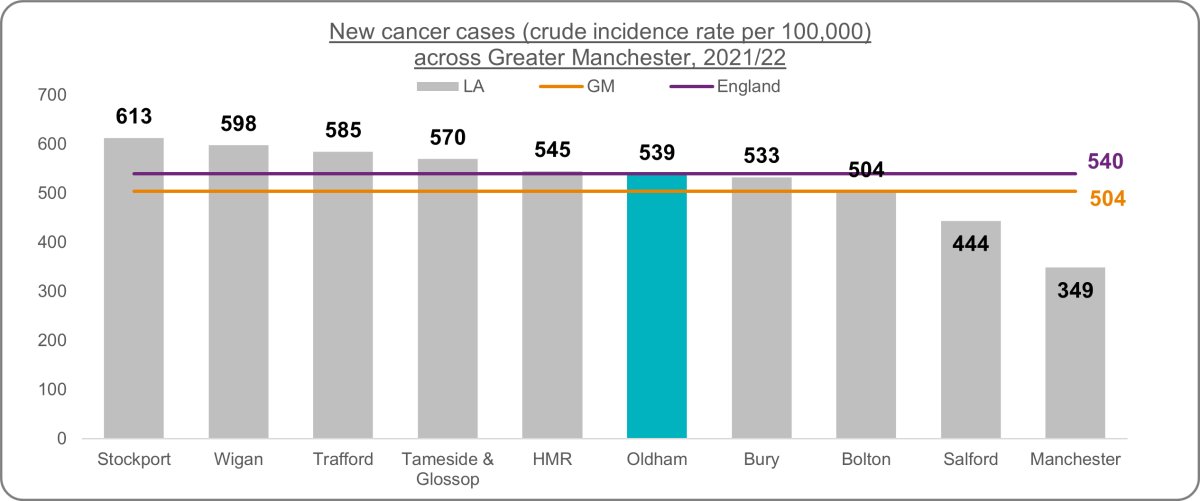
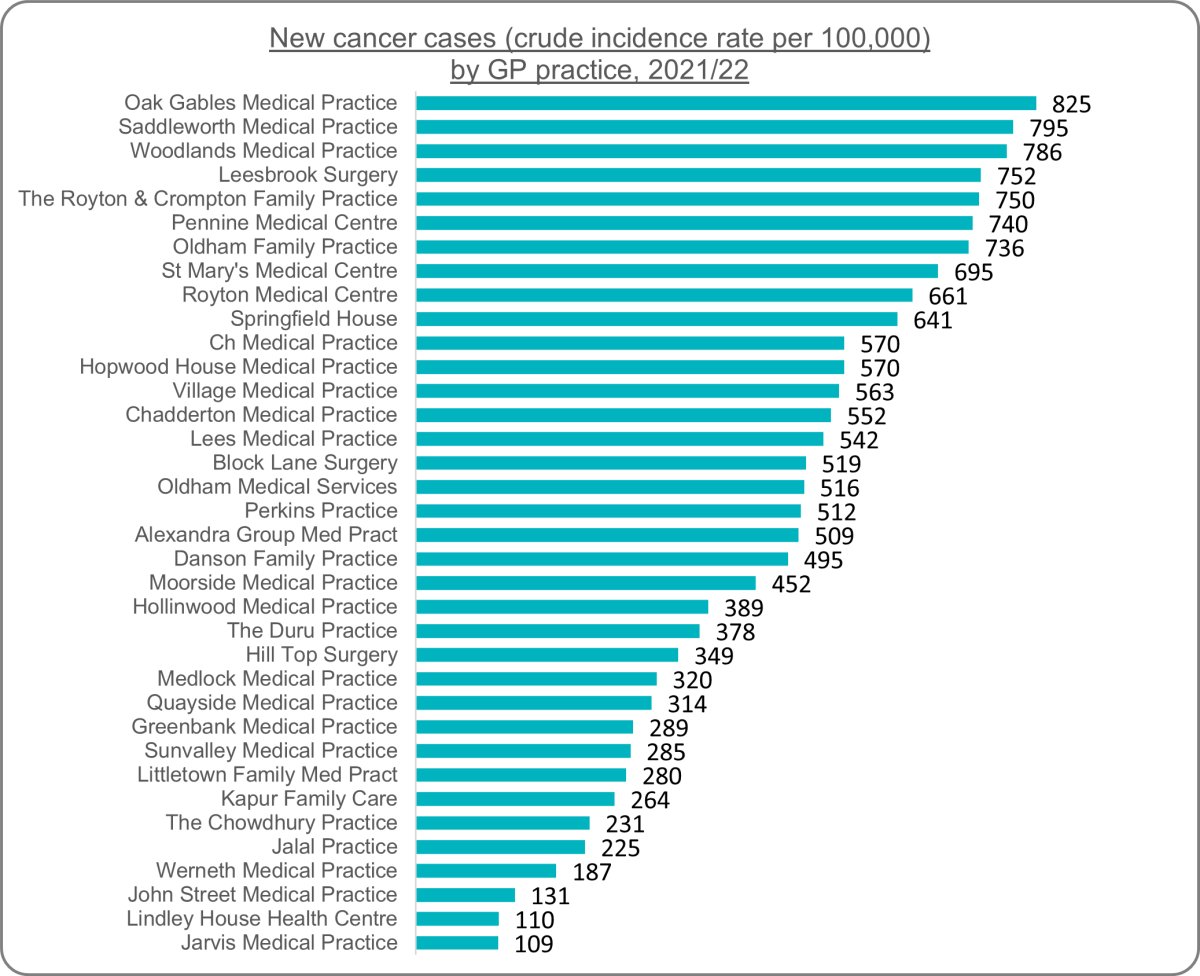
The below data gives the total number of new cases and incidence rate of malignant cancer (excluding non-melanoma skin cancer) in the population, as estimated from cancer registry data for the financial year. These diagnoses may result from an urgent suspected cancer referral, other GP referral or via other (non-GP) routes. Rates are likely to reflect the underlying risk of cancer among the practice's population; for example, they will typically by higher in practices with an older than average population.Oldham's latest cancer incidence of 539 per 100,000 is in line with the national average of 540 per 100,000 and lower than the North West rate of 570 per 100,000. All areas experienced a decrease in cancer diagnosis during the Covid-19 pandemic, with rates increasing again in 2021/22. Looking over the entire period shown, rates in Oldham have increased by 19%. This rate of increase is higher than regional and national increases (both 12%). Oldham ranks 5th lowest across Greater Manchester. The variation between GP practices is stark. Jarvis Medical Practice has the lowest rate at 109 per 100,000 and Oak Gables Medical Practice has the highest rate at 825 per 100,000. Some of this variation can be attributed to the different demographic compositions of the patients, as this is calculated as a crude rate. This means different age structures are not accounted for in the calculation. To enable valid comparisons, the percentage of each practice population aged over 65 is presented in figure x on this page.
Figure 1: New cancer cases (crude incidence rate per 100,000) trend
 Source: NHS England, National Disease Registration Service
Figure 2: New cancer cases (crude incidence rate per 100,000) across Greater Manchester
 Source: NHS England, National Disease Registration Service
Figure 3: New cancer cases (crude incidence rate per 100,000) by GP practice
 Source: NHS England, National Disease Registration Service
Prevalence
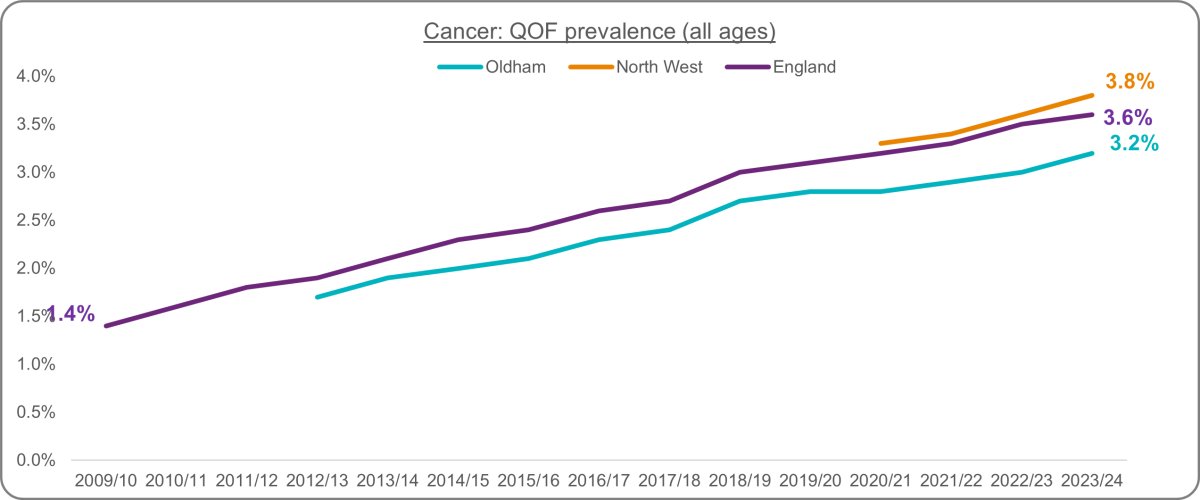
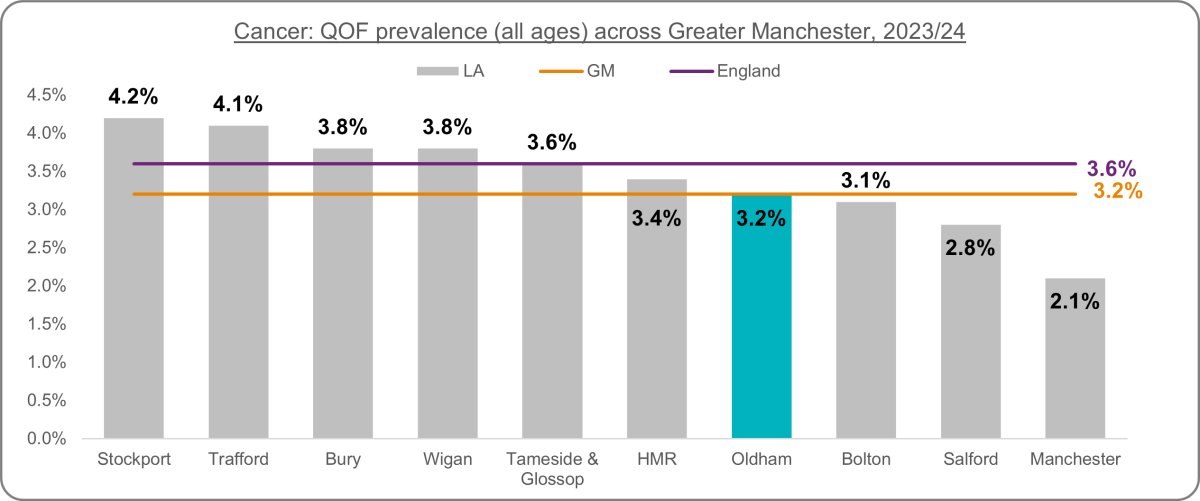
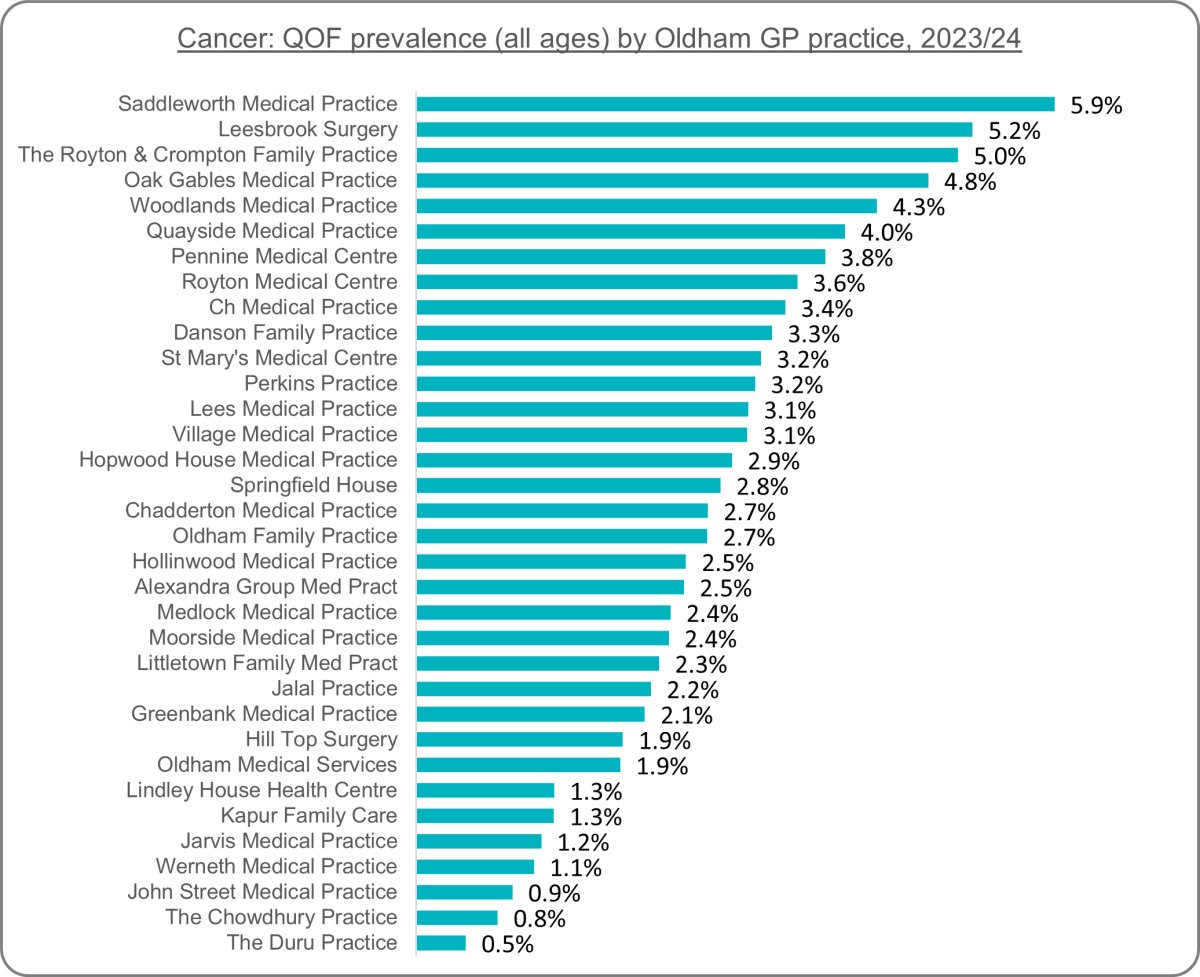
The following data represents the percentage of patients with cancer in the population, as recorded on practice disease registers (cancer excluding non-melanotic skin cancers). This is the prevalence of cancer.Oldham's latest prevalence of cancer is 3.2%, lower than the national average of 3.6% and the regional average of 3.8%. Rates have been steadily increasing across all areas, with prevalence almost doubling since 2012/13 in both Oldham and England. Data is unavailable at regional level for this comparison. This represents 8,492 people in Oldham living with cancer in 2023/24, compared to 4,176 in 2012/13. Oldham#s rate is 4th lowest across Greater Manchester. Across GP practices, rates range from 5.9% at Saddleworth Medical Practice to 0.5% at the Duru Practice. Similarly to the incidence rate, the age differences between practices needs to be considered when interpreting this measure. The percentage of each practice population aged over 65 is presented in figure x on this page.
Figure 4: Cancer QOF prevalence trend
 Source: NHS England
Figure 5: Cancer QOF prevalence across Greater Manchester
 Source: NHS England
Figure 6: Cancer QOF prevalence by GP practice
 Source: NHS England
Emergency Hospital Admissions
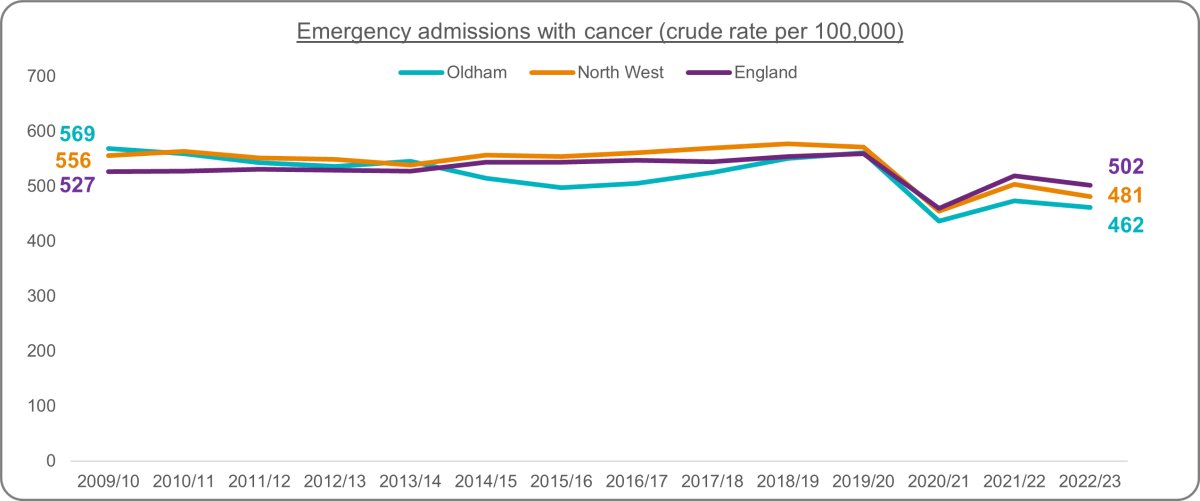
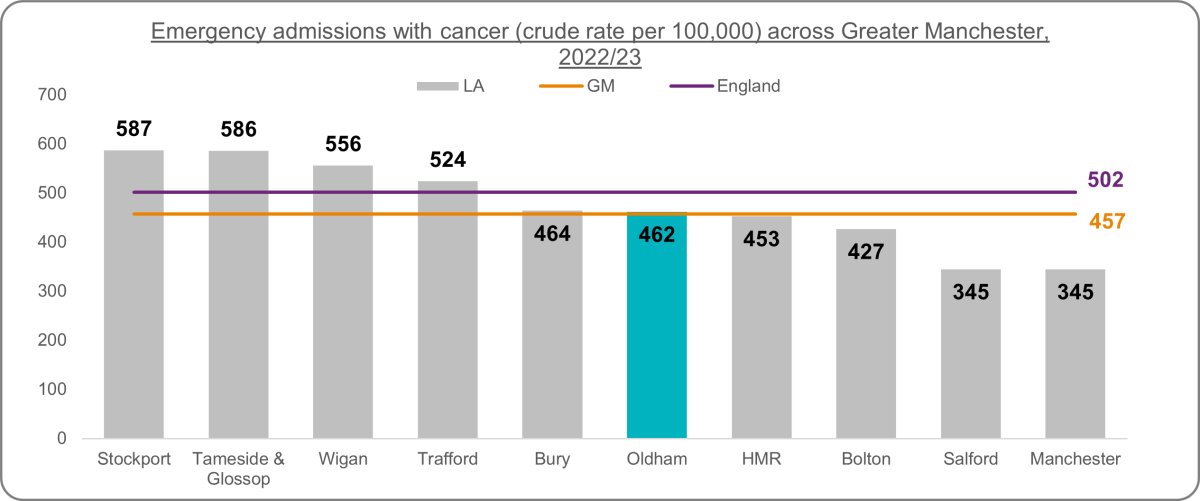
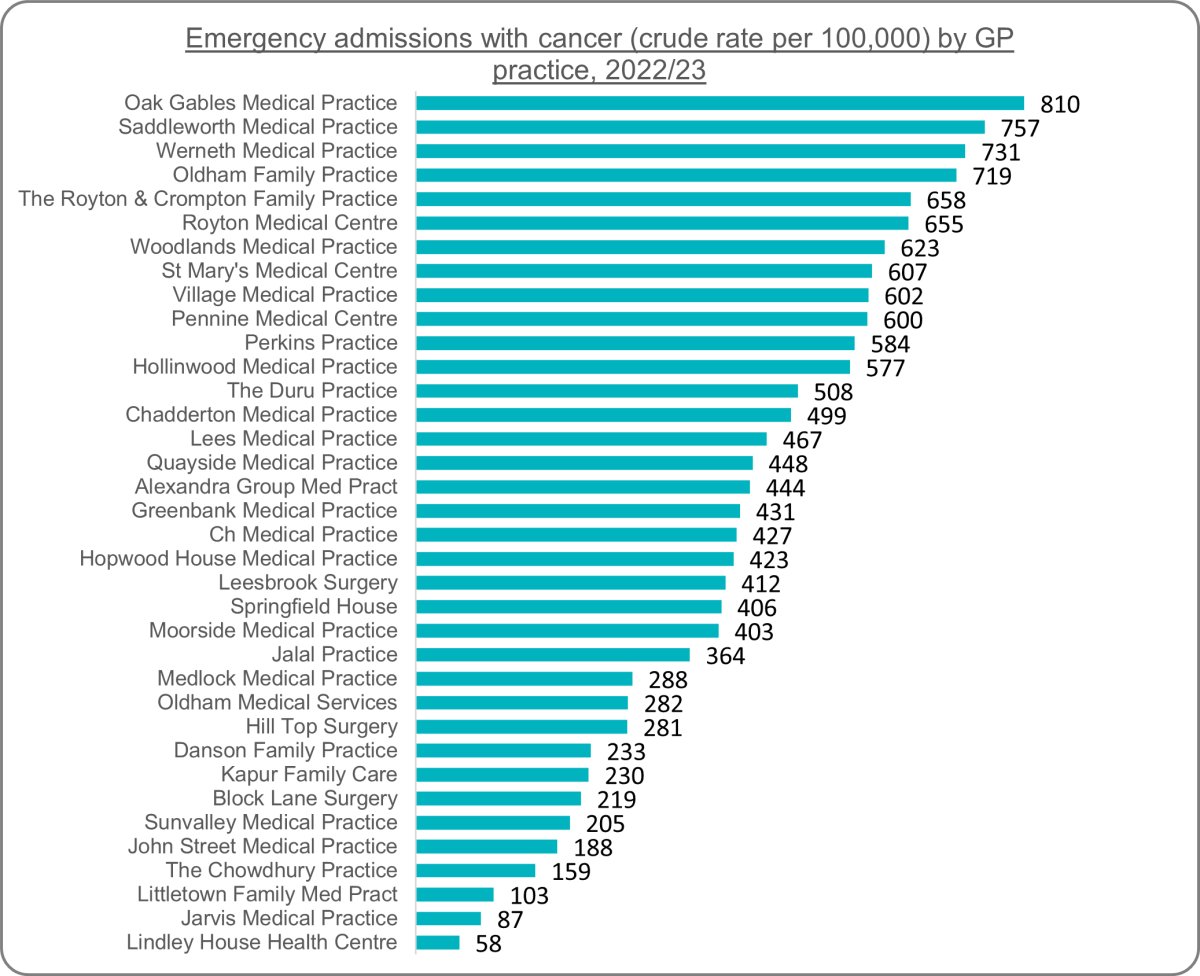
Emergency admissions may result from a number of mechanisms; they may: reflect an urgent need which can only be met via emergency routes; follow a GP consultation which advised emergency care; or reflect a previously unrequested and/or unmet need. These admissions may be related to a new diagnosis (see emergency presentations data below), an existing diagnosis, or a recurring diagnosis. The data that follows represents the crude rate per 100,000 persons of inpatient or day-case emergency admissions, with a diagnostic code that includes cancer.Oldham's latest rate of emergency hospital admissions with cancer is 462 per 100,000. This is lower than the North West average of 481 per 100,000 and the England average of 502 per 100,000. Rates decreased across all areas during the Covid-19 pandemic and rates have not returned to pre-pandemic levels, with the rate in 2022/23 18% lower than in 2019/20.Oldham is 5th lowest across Greater Manchester. Rates vary greatly between GP practices, with Oak Gables Medical Practice having the highest rate at 810 per 100,000 and Lindley House Health Centre the lowest at 58 per 100,000. Similarly to the previous measures, the age differences between practices needs to be considered when interpreting this measure. The percentage of each practice population aged over 65 is presented in figure x on this page.
Figure 7: Emergency hospital admissions with cancer (crude rate per 100,000) trend
 Source: NHS England, National Disease Registration Service
Figure 8: Emergency hospital admissions with cancer (crude rate per 100,000) across Greater Manchester
 Source: NHS England, National Disease Registration Service
Figure 9: Emergency hospital admissions with cancer (crude rate per 100,000) by GP practice
 Source: NHS England, National Disease Registration Service
Emergency Hospital Presentations
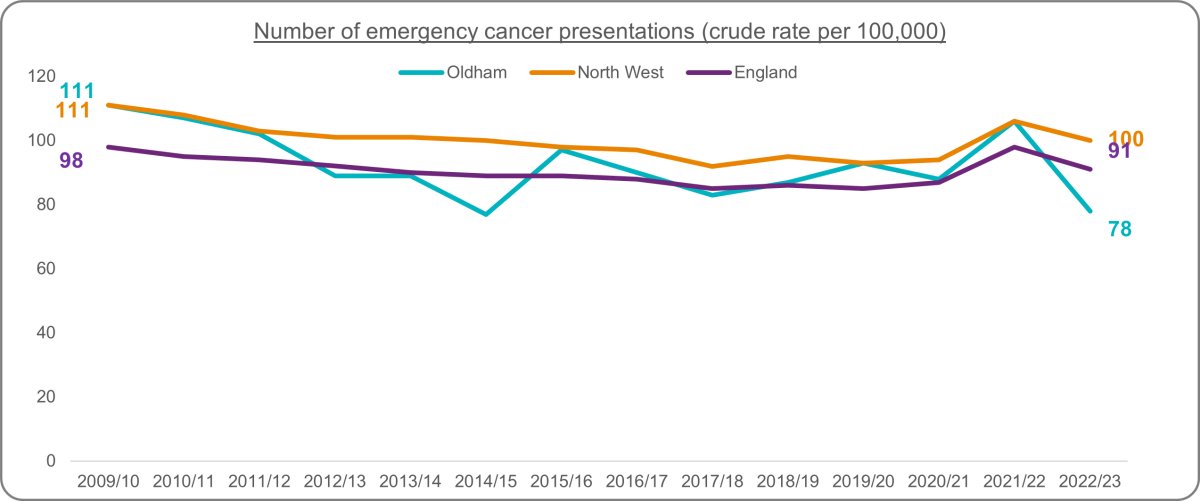
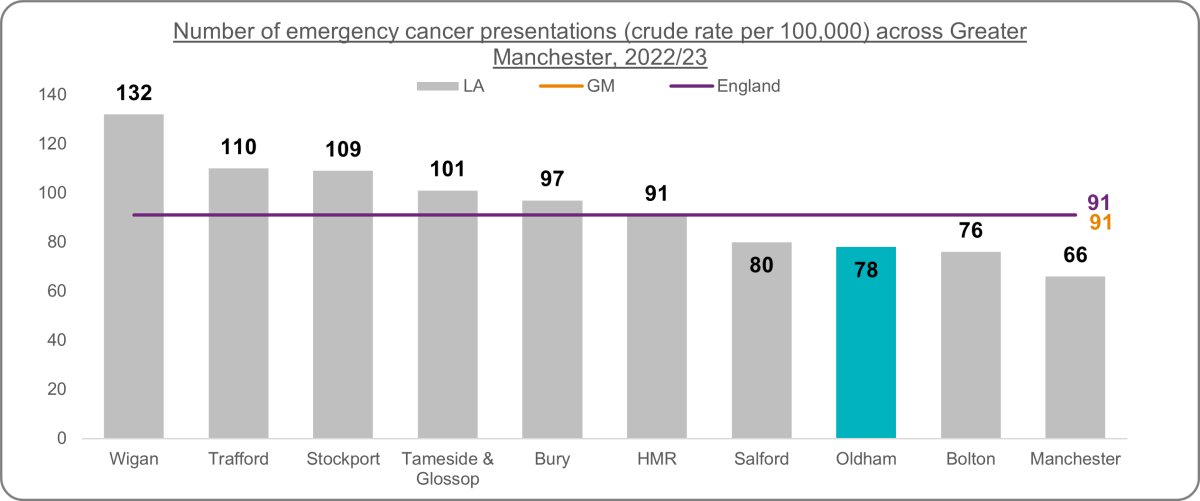
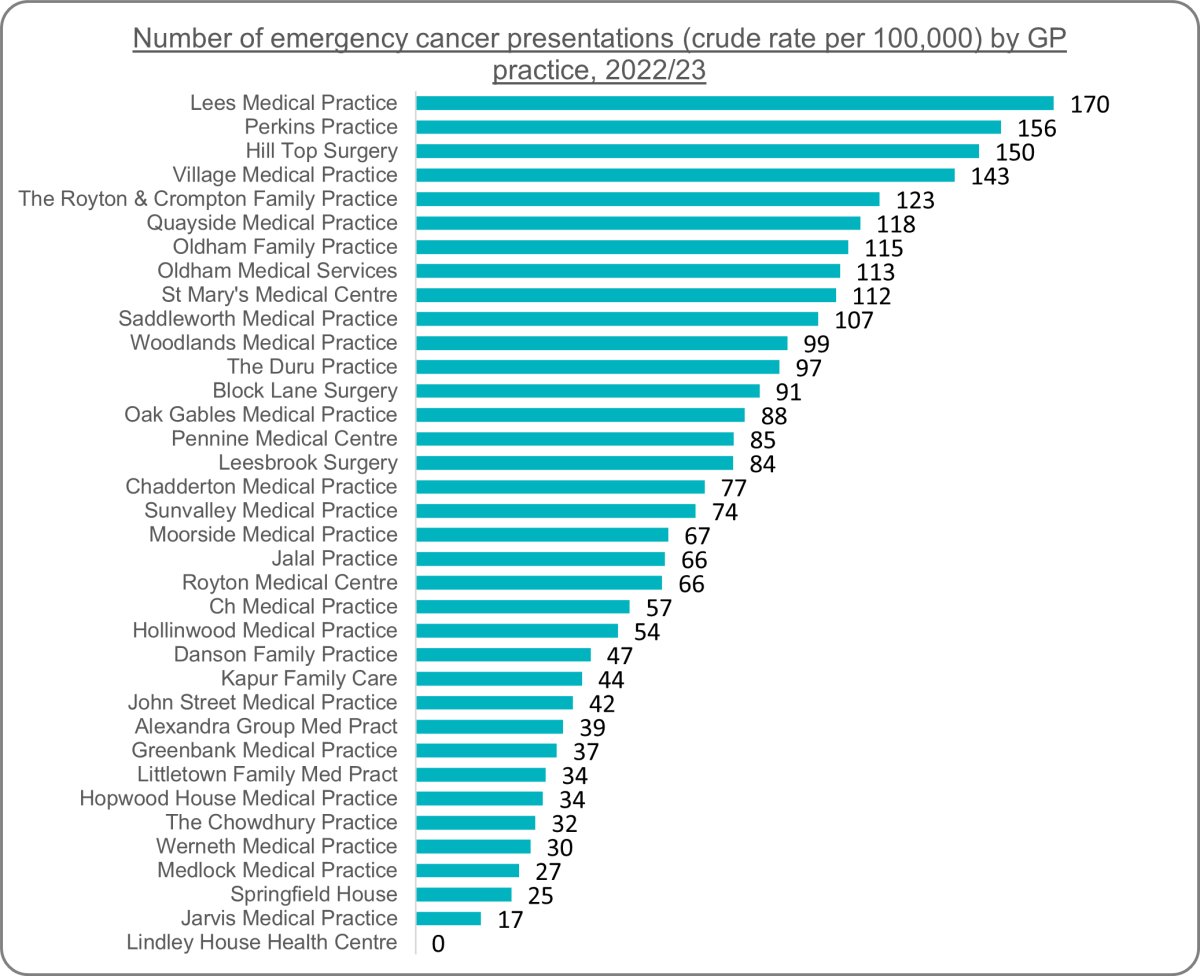
Emergency presentation is linked to lower short-term survival in newly diagnosed patients. However, it is strongly affected by case-mix: more emergency presentations can be expected in older practice populations and the mix of tumour types is also highly significant (for example, lung cancers have a higher fraction of emergency presentations while breast cancers have a low fraction of emergency presentations). This measure represents the number of people diagnosed with cancer via an emergency route per 100,000 persons, expressed as a crude rate.Oldham's latest rate of 78 per 100,000 is lower than the national average of 91 per 100,000 and the North West average of 100 per 100,000. Previously to the latest year, Oldham's rate was similar to the national average for a significant amount of years preceding. Oldham is 3rd lowest across Greater Manchester. Lees Medical Practice has the highest rate at 170 per 100,000 and Lindley House Health Centre did not record any emergency hospital presentations with cancer. Similarly to the previous measures, the age differences between practices needs to be considered when interpreting this measure. The percentage of each practice population aged over 65 is presented in figure x on this page.
Figure 10: Number of emergency cancer presentations (crude rate per 100,000) trend
 Source: NHS England, National Disease Registration Service
Figure 11: Number of emergency cancer presentations (crude rate per 100,000) across Greater Manchester
 Source: NHS England, National Disease Registration Service
Figure 12: Number of emergency cancer presentations (crude rate per 100,000) by GP practice
 Source: NHS England, National Disease Registration Service
Age Structure by GP Practice
This measure is presented to provide some context to the varying rates between GP practices identified in the indicators above.Figure 13: Percentage of GP practice population aged 65+
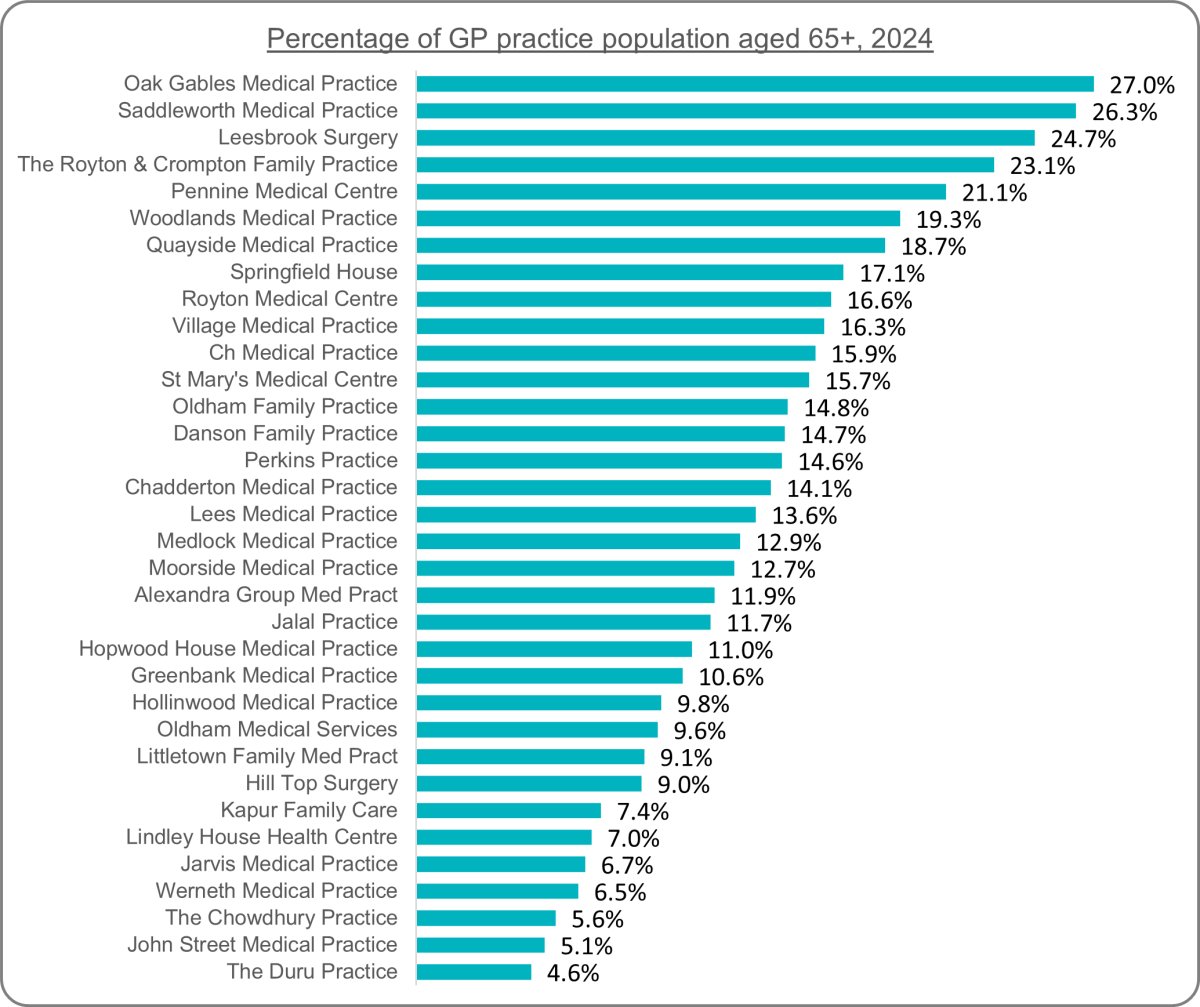 Source: NHS England
 Further Information & Resources
NHS InformationInformation and advice from the NHS on cancer.
Cancer Research UK
Cancer charity providing help, support and advice to those living with cancer.
World Health Organisation Cancer Fact Sheet
Fact Sheet from WHO outlining headline figures globally.
NHS Cancer Registrations Statistics, England
This publication reports on newly diagnosed cancers registered in England during 2021. It includes this summary report showing key findings, spreadsheet tables with more detailed estimates, and a methodology document.
Macmillan Cancer Support
Macmillan help everyone affected by cancer to live life as fully as they can, by providing physical, financial and emotional support.
References
[1] Cancer Research UK, https://www.cancerresearchuk.org/health-professional/cancer-statistics-for-the-uk#heading-Three, accessed November 2024.[2] NHS conditions page on cancer, https://www.nhs.uk/conditions/cancer/, accessed November 2024.
....